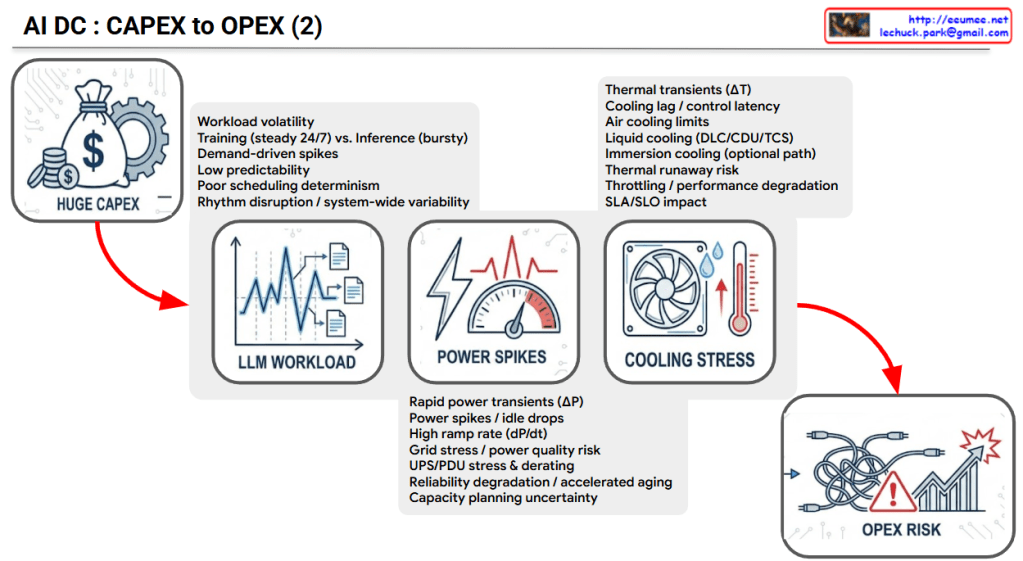
The provided image logically illustrates the sequential mechanism of how the massive initial capital expenditure (CAPEX) of an AI Data Center (AI DC) translates into complex operational risks and increased operating expenses (OPEX).
1. HUGE CAPEX (Massive Initial Investment)
Context: Building an AI data center requires enormous capital expenditure (CAPEX) due to high-cost GPU servers, high-density racks, and specialized networking infrastructure.
Flow: However, the challenge does not end with high initial costs. Driven by the following three factors, this massive infrastructure investment inevitably cascades into severe operational risks.
2. LLM WORKLOAD (The Root Cause)
Characteristics: Unlike traditional IT workloads, AI (especially LLM) workloads are highly volatile and unpredictable.
Key Factors: * The continuous, heavy load of Training (steady 24/7) mixed with the bursty, erratic nature of Inference.
Demand-driven spikes and low predictability, which lead to poor scheduling determinism and system-wide rhythm disruption.
3. POWER SPIKES (Electrical Infrastructure Stress)
Characteristics: The extreme volatility of LLM workloads causes sudden, extreme fluctuations in server power consumption.
Key Factors:
Rapid power transients (ΔP) and high ramp rates (dP/dt) create sudden power spikes and idle drops.
These fluctuations cause significant grid stress, accelerate the aging of power distribution equipment (UPS/PDU stress & derating), degrade overall system reliability, and create major capacity planning uncertainty.
4. COOLING STRESS (Thermal System Stress)
Characteristics: Sudden surges in power consumption immediately translate into rapid temperature increases (Thermal transients, ΔT).
Key Factors:
Cooling lag / control latency: There is an inevitable delay between the sudden heat generation and the cooling system’s physical response.
Physical limits: Traditional air cooling hits its limits, forcing transitions to Liquid cooling (DLC/CDU) or Immersion cooling. Failure to manage this latency increases the risk of thermal runaway, triggers system throttling (performance degradation), and negatively impacts SLAs/SLOs.
5. OPEX RISK (The Final Operational Consequence)
Context: The combination of unpredictable LLM workloads, power infrastructure stress, and cooling system limitations culminates in severe OPEX Risk.
Conclusion: Ultimately, this chain reaction exponentially increases daily operational costs and uncertainties—ranging from accelerated equipment replacement costs and higher power bills (due to degraded PUE) to massive expenses related to frequent incident responses and infrastructure instability.
Summary:
The slide delivers a powerful message: While the physical construction of an AI data center is highly expensive (CAPEX), the true danger lies in the unique volatility of AI workloads. This volatility triggers extreme power (ΔP) and thermal (ΔT) spikes. If these physical transients are not strictly managed, the operational costs and risks (OPEX) will spiral completely out of control.
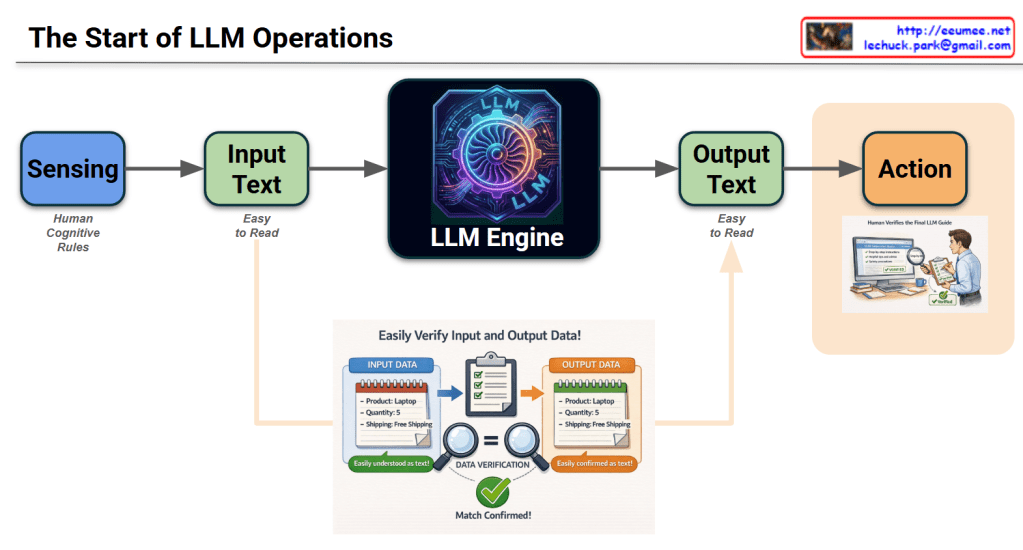
This infographic, titled “The Start of LLM Operations,” illustrates the end-to-end workflow of how a Large Language Model (LLM) processes information to drive real-world outcomes.
Detailed Breakdown of the Workflow
1. Core Process Flow (Horizontal Axis)
Sensing: The initial stage where data is gathered based on Human Cognitive Rules. It represents the system “perceiving” the environment or requirements.
Input Text: Data is converted into a format that is “Easy to Read” for humans, ensuring the prompt or command is transparent.
LLM Engine: The central processing unit (symbolized by a high-tech gear) that analyzes the input and generates a response.
Output Text: The engine produces a result, again in a human-readable format, to ensure clarity before execution.
Action: The final stage where the output is translated into a functional task or operation.
2. Data Verification (Bottom Inset)
This section highlights the critical “Check & Balance” mechanism:
Input Data vs. Output Data: It shows a specific example (Product: Laptop, Quantity: 5, Shipping: Free).
Validation: The use of magnifying glasses and a green checkmark (Match Confirmed!) emphasizes that the output must strictly align with the input requirements to prevent hallucinations or errors.
3. Human-in-the-Loop (Right Section)
The image of the person reviewing a checklist (“Human Verifies the Final LLM Guide”) signifies that human oversight is the final gatekeeper. Before the “Action” is taken, a person ensures the AI’s logic and results are safe and accurate.
Summary & Insight
The diagram suggests that successful LLM operations are not just about the model’s intelligence, but about transparency and verification. By keeping data “Easy to Read” and involving “Human Verification,” the system ensures that AI-driven actions are reliable and grounded in human-defined rules.
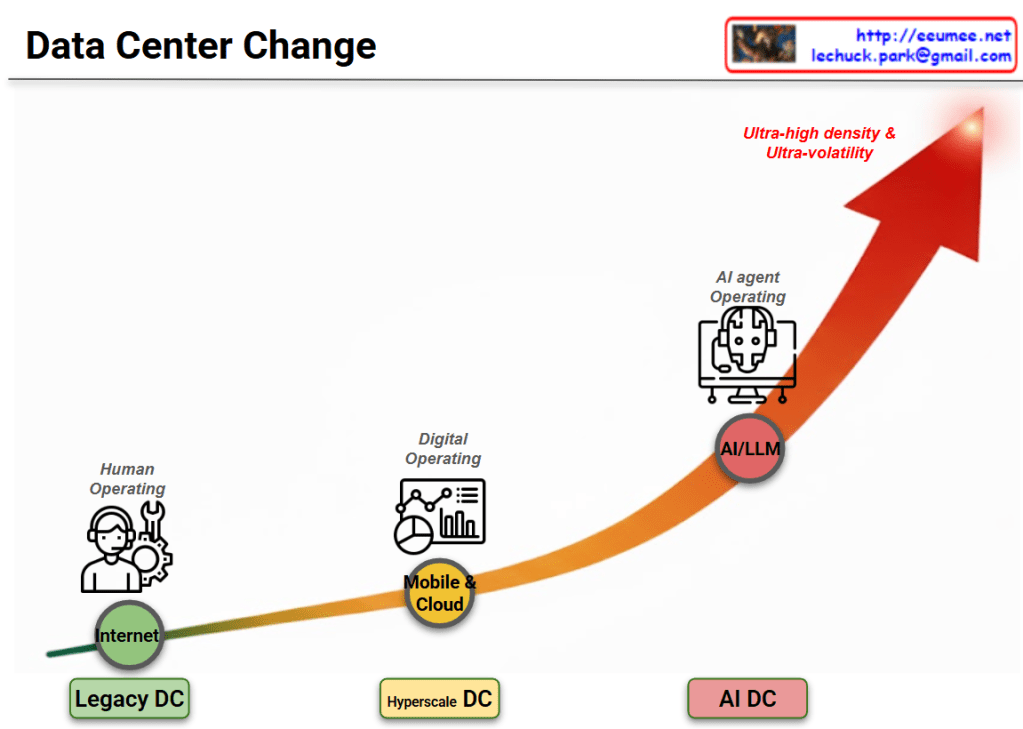
This diagram illustrates the evolutionary progression of infrastructure environments and operational methodologies over time. The upward-pointing arrow indicates the escalating complexity, density, and sophistication of these technologies.
Phase 1: Internet Era
Environment: Legacy Data Center
Core Technology: Internet
Operating Model: Human Operating
Characteristics: The foundational stage where human operators physically monitor and control the infrastructure, relying heavily on manual intervention and traditional toolsets.
Phase 2: Mobile & Cloud Era
Environment: Hyperscale Data Center
Core Technology: Mobile & Cloud
Operating Model: Digital Operating
Characteristics: A digital transformation phase designed to handle explosive data growth. This stage utilizes dashboards, analytics, and automated systems to significantly improve operational efficiency and scale.
Phase 3: Artificial Intelligence Era
Environment: AI Data Center
Core Technology: AI/LLM (Large Language Models)
Operating Model: AI Agent Operating
Characteristics: A highly advanced stage where an AI-driven agent takes over the integrated operations of the platform. It functions autonomously to manage and optimize the system, specifically to cope with the “Ultra-high density & Ultra-volatility” characteristic of modern AI workloads.
Summary
The diagram outlines a fundamental paradigm shift in infrastructure management. It traces the journey from early, manual-heavy environments to digitalized systems, ultimately culminating in an advanced era where an AI-driven agent autonomously manages operations for AI Data Centers, expertly handling environments defined by extreme density and volatility.
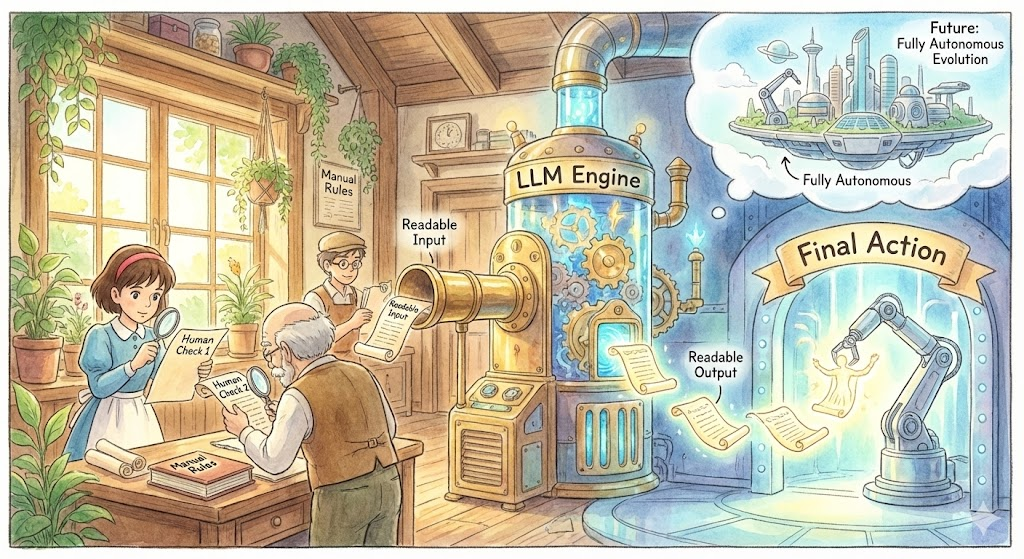
🤖 Strategic Overview: The Most Accessible LLM Framework
This framework is designed as a Human-in-the-loop architecture. It prioritizes immediate usability and safety while serving as a critical stepping stone toward Fully Autonomous AI.
1. Human-Guided Foundation (Input Phase)
Manual Rules & Structured Data: Instead of relying on raw, unpredictable data, humans define clear “Manual Rules.” This ensures the LLM Engine receives high-quality, “Readable Input.”
Initial Verification (Human Check 1 & 2): Every piece of information is scrutinized before it enters the AI core. This eliminates the risk of “garbage in, garbage out” and ensures the AI operates within a predefined ethical and logical boundary.
2. Transparent Processing (The Engine)
The LLM Engine: The AI performs the heavy lifting—reasoning, summarizing, and generating content—based on the verified input.
Readable Output: The system is designed to produce results that are easy for humans to interpret. This transparency removes the “Black Box” problem, making the AI’s logic visible and manageable.
3. Safety-First Execution (Output Phase)
The Final Gatekeeper (Human Check 3): Before any “Final Action” (like sending an email or updating a database) is taken, a human provides the final stamp of approval.
Reliability: This layer of human oversight ensures that the AI’s “hallucinations” or errors are caught before they have real-world consequences.
4. The Evolutionary Path (Future Vision)
Data as an Asset: Every human intervention and correction in this “easy” setup is recorded. This creates a high-quality feedback loop (RLHF – Reinforcement Learning from Human Feedback).
Transition to Autonomy: As the AI learns from these human corrections, the need for manual checks will gradually decrease. Eventually, the system will evolve into the “Fully Autonomous Evolution” shown in the illustration—a state where the AI operates independently with peak efficiency.
Key Takeaway: This approach is “easiest” because it builds trust and safety through human intuition today, while systematically building the data foundation needed for a fully automated tomorrow.
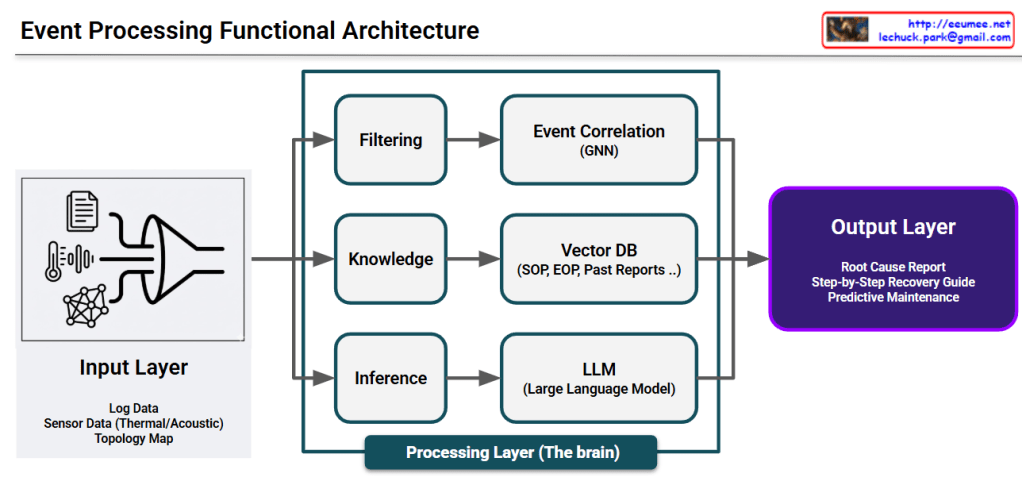
This image illustrates a Data Processing Pipeline (Architecture) where raw data is ingested, analyzed through an AI engine, and converted into actionable business intelligence.
## Image Interpretation: AI-Driven Data Pipeline
### 1. Input Layer (Left: Data Ingestion)
This represents the raw data collected from various sources within the infrastructure:
Log Data (Document Icon): System logs and event records that capture operational history.
Sensor Data (Thermometer & Waveform Icons): Real-time monitoring of physical environments, specifically focusing on Thermal (heat) and Acoustic (noise) patterns.
Topology Map (Network Icon): The structural map of equipment and their interconnections, providing context for how data flows through the system.
### 2. Integration & Processing (Center: The AI Funnel)
The Funnel/Pipe Shape: This symbolizes the process of data fusion and refinement. It represents different data types being standardized and processed through an AI model or analytics engine to filter out noise and identify patterns.
### 3. Output Layer (Right: Actionable Insights)
The final results generated by the analysis, designed to provide immediate value to operators:
Root Cause Report (Document with Magnifying Glass): Identifies the underlying reason for a specific failure or anomaly.
Step-by-Step Recovery Guide (Checklist with Arrows): Provides a sequential, automated, or manual procedure to restore the system to a healthy state.
Predictive Maintenance (Gear with Upward Arrow): Utilizes historical trends to predict potential failures before they occur, optimizing maintenance schedules and reducing downtime.
# Summary
The diagram effectively visualizes the transition from complex raw data to actionable intelligence. It highlights the core value of an AI-driven platform: reducing cognitive load for human operators by providing clear, data-backed directions for maintenance and recovery.