Events with RAG(LLM)

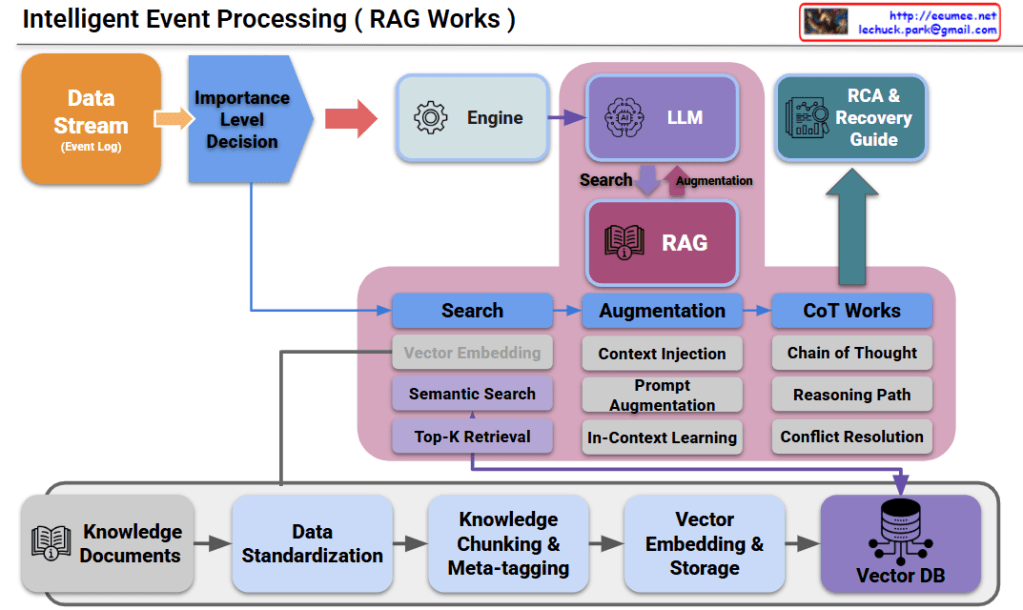
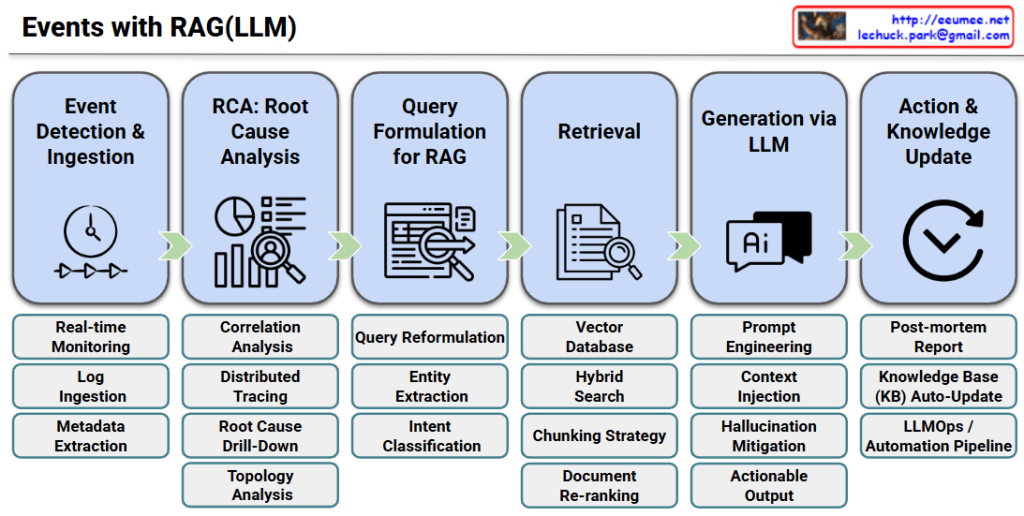
Step 1: Event Detection & Ingestion

This initial stage focuses on capturing system anomalies through real-time monitoring, collecting necessary logs, and extracting essential metadata to understand the context of the event.

Step 2: RCA: Root Cause Analysis

It identifies the fundamental issue behind the surface-level symptoms by utilizing correlation analysis, distributed tracing, root cause drill-down, and infrastructure topology analysis.

Step 3: Query Formulation for RAG

The system translates the RCA findings into an optimized search prompt through query reformulation, entity extraction, and intent classification to fetch the most accurate solutions.

Step 4: Retrieval

It searches for the most relevant technical documents or past incident records from a Vector Database, leveraging hybrid search, chunking strategies, and document re-ranking techniques.

Step 5: Generation via LLM

The LLM generates an actionable troubleshooting guide by combining prompt engineering and context injection, strictly mitigating any AI hallucinations.

Step 6: Action & Knowledge Update

Finally, after the issue is resolved, the system automatically updates its knowledge base with post-mortem reports, ensuring a continuous feedback loop through an automated LLMOps pipeline.


Summary

  1. Event Detection & Root Cause Analysis: When a system incident occurs, it is captured in real-time, and the system deeply traces the actual root cause rather than just addressing surface-level symptoms.
  2. Knowledge Retrieval & Solution Generation: The analyzed root cause is transformed into a RAG-optimized query to retrieve the best reference documents from the internal knowledge base, allowing the LLM to generate an immediately actionable troubleshooting guide.
  3. Knowledge Capitalization & Virtuous Cycle: Once the issue is resolved, a post-mortem report is generated and automatically fed back into the knowledge base, creating a continuously evolving and automated pipeline.

#AIOps #RAG_Architecture #RootCauseAnalysis #LLMOps #IncidentManagement #TroubleshootingAutomation #VectorDatabase

With Gemini

Operation Evolutions

By following the red circle with the ‘Actions’ (clicking hand) icon, you can easily track how the control and operational authority shift throughout the four stages.

Stage 1: Human Control

  • Structure: Facility ➡️ Human Control
  • Description: This represents the most traditional, manual approach. Without a centralized data system, human operators directly monitor the facility’s status and manually execute all Actions based on their physical observations and judgment.

Stage 2: Data System

  • Structure: Facility ➡️ Data System ➡️ Human Control
  • Description: A monitoring or data system (like a dashboard) is introduced. Humans now rely on the data collected by the system to understand the facility’s condition. However, the final Actions are still manually performed by humans.

Stage 3: Agent Co-work

  • Structure: Facility ➡️ Data System ➡️ Agent Co-work ➡️ Human Control
  • Description: An AI Agent is introduced as an intermediary between the data system and the human operator. The AI analyzes the data and provides insights, recommendations, or assistance. Even with this support, the final decision-making and physical Actions remain entirely the human’s responsibility.

Stage 4: Autonomous (Auto-nomous)

  • Structure: Facility ➡️ Data System ➡️ Auto-nomous ↔️ Human Guide
  • Description: This is the ultimate stage of operational evolution. The authority to execute Actions has shifted from the human to the AI. The AI analyzes data, makes independent decisions, and autonomously controls the facility. The human’s role transitions from a direct controller to a ‘Human Guide’, supervising the AI and providing high-level directives. The two-way arrow indicates a continuous, interactive feedback loop where the human and AI collaborate to refine and optimize the system.

Summary:

This slide intuitively illustrates a paradigm shift in infrastructure operations: progressing from Direct Human Intervention ➡️ System-Assisted Cognition ➡️ AI-Assisted Operations (Co-work) ➡️ Fully Autonomous AI Control with Human Supervision.

#AIOps #AutonomousOperations #TechEvolution #DigitalTransformation #DataCenter #FacilityManagement #InfrastructureAutomation #SmartFacilities #AIAgents #FutureOfWork #HumanAndAI #Automation

with Gemini

SRE for AI Factory

Comprehensive Image Analysis: SRE for AI Factory

1. Operational Evolution (Bottom Flow)

  • Human Operating (Traditional DC): Depicts the legacy stage where manual intervention and physical inspections are the primary means of management.
  • Digital Operating: A transitional phase represented by dashboards and data visualization, moving toward data-informed decision-making.
  • AI Agent Operating (AI Factory): The future state where autonomous AI agents (like your AIDA platform) manage complex infrastructures with minimal human oversight.

2. Shift in Core Methodology (Top Transition)

  • Facility-First Operation: Focuses on the physical health of hardware (Transformers, Cooling units) to ensure basic uptime.
  • Software-Defined Operation (Highlighted): The centerpiece of the transition. It treats infrastructure as code, using software logic and AI to control physical assets dynamically.

3. The Solution: SRE (Site Reliability Engineering)

The image identifies SRE as the definitive answer to the question “Who can care for it?” by applying three technical pillars:

  • Advanced Observability: Moving beyond binary alerts to deep Correlation Analysis of power and cooling data.
  • Error Budget Management: Quantitatively Balancing Efficiency (PUE) vs. Reliability to push performance without risking failure.
  • Toil Reduction & Automation: Achieving scalability through Autonomous AI Control, eliminating repetitive manual tasks.

3-Line Summary

  • Paradigm Shift: Evolution from hardware-centric “Facility-First” management to code-driven “Software-Defined Operation.”
  • The Role of SRE: Implementation of SRE principles is the essential bridge to managing the high complexity of AI Factories.
  • Operational Pillars: Success relies on Advanced Observability, Error Budgeting (PUE optimization), and Toil Reduction via AI automation.

#AIFactory #SRE #SoftwareDefinedOperation #AIOps #DataCenterAutomation #Observability #InfrastructureAsCode

with Gemini

Easy LLM


🤖 Strategic Overview: The Most Accessible LLM Framework

This framework is designed as a Human-in-the-loop architecture. It prioritizes immediate usability and safety while serving as a critical stepping stone toward Fully Autonomous AI.

1. Human-Guided Foundation (Input Phase)

  • Manual Rules & Structured Data: Instead of relying on raw, unpredictable data, humans define clear “Manual Rules.” This ensures the LLM Engine receives high-quality, “Readable Input.”
  • Initial Verification (Human Check 1 & 2): Every piece of information is scrutinized before it enters the AI core. This eliminates the risk of “garbage in, garbage out” and ensures the AI operates within a predefined ethical and logical boundary.

2. Transparent Processing (The Engine)

  • The LLM Engine: The AI performs the heavy lifting—reasoning, summarizing, and generating content—based on the verified input.
  • Readable Output: The system is designed to produce results that are easy for humans to interpret. This transparency removes the “Black Box” problem, making the AI’s logic visible and manageable.

3. Safety-First Execution (Output Phase)

  • The Final Gatekeeper (Human Check 3): Before any “Final Action” (like sending an email or updating a database) is taken, a human provides the final stamp of approval.
  • Reliability: This layer of human oversight ensures that the AI’s “hallucinations” or errors are caught before they have real-world consequences.

4. The Evolutionary Path (Future Vision)

  • Data as an Asset: Every human intervention and correction in this “easy” setup is recorded. This creates a high-quality feedback loop (RLHF – Reinforcement Learning from Human Feedback).
  • Transition to Autonomy: As the AI learns from these human corrections, the need for manual checks will gradually decrease. Eventually, the system will evolve into the “Fully Autonomous Evolution” shown in the illustration—a state where the AI operates independently with peak efficiency.

Key Takeaway: This approach is “easiest” because it builds trust and safety through human intuition today, while systematically building the data foundation needed for a fully automated tomorrow.

#LLM #AI_Strategy #HumanInTheLoop #AutonomousAI #FutureOfAI #AIOps #AI_Evolution #GenerativeAI #DataStrategy

With Gemini

Intelligent Event Analysis Framework ( RAG Works )

This diagram illustrates a sophisticated Intelligent Event Processing architecture that utilizes Retrieval-Augmented Generation (RAG) to transform raw system logs into actionable technical solutions.

Architecture Breakdown: Intelligent Event Processing (RAG Works)

1. Data Inflow & Prioritization

  • Data Stream (Event Log): The system captures real-time logs and events.
  • Importance Level Decision: Instead of processing every minor log, this “gatekeeper” identifies critical events, ensuring the AI engine focuses on high-priority issues.

2. The RAG Core (The Reasoning Engine)

This is the heart of the system (the pink area), where the AI analyzes the problem:

  • Search (Retrieval): The system performs a Semantic Search and Top-K Retrieval to find the most relevant technical information from the Vector DB.
  • Augmentation: It injects this retrieved context into the LLM (Large Language Model) via In-Context Learning, giving the model “temporary memory” of your specific systems.
  • CoT Works (Chain of Thought): This is the “thinking” phase. It uses a Reasoning Path to analyze the data step-by-step and performs Conflict Resolution to ensure the final answer is logically sound.

3. Knowledge Management Pipeline

The bottom section shows how the system “learns”:

  • Knowledge Documents: Technical manuals, past incident reports, and guidelines are collected.
  • Standardization & Chunking: Data is broken down into manageable “chunks” and tagged with metadata.
  • Vector DB: These chunks are converted into mathematical vectors (embeddings) and stored, allowing the engine to search for “meaning” rather than just keywords.

4. Final Output

  • RCA & Recovery Guide: The ultimate goal. The system doesn’t just say there’s an error; it provides a Root Cause Analysis (RCA) and a step-by-step Recovery Guide to help engineers fix the issue immediately.

Summary

  1. Automated Intelligence: It’s an “IT First Responder” that converts raw system noise into precise, logical troubleshooting steps.
  2. Context-Aware Analysis: By combining RAG with Chain-of-Thought reasoning, the system “reads the manual” for you to solve complex errors.
  3. Data-Driven Recovery: The workflow bridges the gap between massive event logs and actionable Root Cause Analysis (RCA) to minimize downtime.

#AIOps #RAG #LLM #GenerativeAI #SystemArchitecture #DevOps #TechInsights #RootCauseAnalysis


With Gemini

Intelligent Event Analysis Framework ( Who the First? )


Intelligent Event Processing System Overview

This architecture illustrates how a system intelligently prioritizes data streams (event logs) and selects the most efficient processing path—either for speed or for depth of analysis.

1. Importance Level Decision (Who the First?)

Events are categorized into four priority levels ($P0$ to $P3$) based on Urgency, Business Impact, and Technical Complexity.

  • P0: Critical (Immediate Awareness Required)
    • Criteria: High Urgency + High Business Impact.
    • Scope: Core service interruptions, security breaches, or life-safety/facility emergencies (e.g., fire, power failure).
  • P1: Urgent (Deep Diagnostics Required)
    • Criteria: High Technical Complexity + High Business Impact.
    • Scope: VIP customer impact, anomalies with high cascading risk, or complex multi-system errors.
  • P2: Normal (Routine Analysis Required)
    • Criteria: High Technical Complexity + Low Business Impact.
    • Scope: General performance degradation, intermittent errors, or new patterns detected after hardware deployment.
  • P3: Info (Standard Logging)
    • Criteria: Low Technical Complexity + Low Business Impact.
    • Scope: General health status logs or minute telemetry changes within designed thresholds.

2. Processing Paths: Fast Path vs. Slow Path

The system routes events through two different AI-driven pipelines to balance speed and accuracy.

A. Fast Path (Optimized for P0)

  • Workflow: Symbolic Engine → Light LLM → Fast Notification.
  • Goal: Minimizes latency to provide Immediate Alerts for critical issues where every second counts.

B. Slow Path (Optimized for P1 & P2)

  • Workflow: Bigger Engine → Heavy LLM + RAG (Retrieval-Augmented Generation) + CoT (Chain of Thought).
  • Goal: Delivers high-quality Root Cause Analysis (RCA) and detailed Recovery Guides for complex problems requiring deep reasoning.

Summary

  1. The system automatically prioritizes event logs into four levels (P0–P3) based on their urgency, business impact, and technical complexity.
  2. It bifurcates processing into a Fast Path using light models for instant alerting and a Slow Path using heavy LLMs/RAG for deep diagnostics.
  3. This dual-track approach maximizes operational efficiency by ensuring critical failures are reported instantly while complex issues receive thorough AI-driven analysis.

#AIOps #IntelligentEventProcessing #LLM #RAG #SystemMonitoring #IncidentResponse #ITAutomation #CloudOperations #RootCauseAnalysis

With Gemini

Intelligent Event Analysis Framework

Intelligent Event Processing Architecture Analysis

The provided diagrams, titled Event Level Flow and Intelligent Event Processing, illustrate a sophisticated dual-path framework designed to optimize incident response within data center environments. This architecture effectively balances the need for immediate awareness with the requirement for deep, evidence-based diagnostics.


1. Data Ingestion and Intelligent Triage

The process begins with a continuous Data Stream of event logs. An Importance Level Decision gate acts as a triage point, routing traffic based on urgency and complexity:

  • Critical, single-source issues are designated as Alert Event One and sent to the Fast Path.
  • Standard or bulk logs are labeled Normal Event Multi and directed to the Slow Path for batch or deeper processing.

2. Fast Path: The Low-Latency Response Track

This path minimizes the time between event detection and operator awareness.

  • A Symbolic Engine handles rapid, rule-based filtering.
  • A Light LLM (typically a smaller parameter model) summarizes the event for human readability.
  • The Fast Notification system delivers immediate alerts to operators.
  • Crucially, a Rerouting function triggers the Slow Path, ensuring that even rapidly reported issues receive full analytical scrutiny.

3. Slow Path: The Comprehensive Diagnostic Track

The Slow Path focuses on precision, using advanced reasoning to solve complex problems.

  • Upon receiving a Trigger, a Bigger Engine prepares the data for high-level inference.
  • The Heavy LLM executes Chain of Thought (CoT) Works, breaking down the incident into logical steps to avoid errors.
  • This is supported by a Retrieval-Augmented Generation (RAG) system that performs a Search across internal knowledge bases (like manuals) and performs an Augmentation to enrich the LLM prompt with specific context.
  • The final output is a comprehensive Root Cause Analysis (RCA) and an actionable Recovery Guide.

Summary

  1. This architecture bifurcates incident response into a Fast Path for rapid awareness and a Slow Path for in-depth reasoning.
  2. By combining lightweight LLMs for speed and heavyweight LLMs with RAG for accuracy, it ensures both rapid alerting and reliable recovery guidance.
  3. The integration of symbolic rules and AI-driven Chain of Thought logic enhances both the operational efficiency and the technical reliability of the system.

#AIOps #LLM #RAG #DataCenter #IncidentResponse #IntelligentMonitoring #AI_Operations #RCA #Automation

With Gemini