Image Analysis: The Evolution of Infrastructure
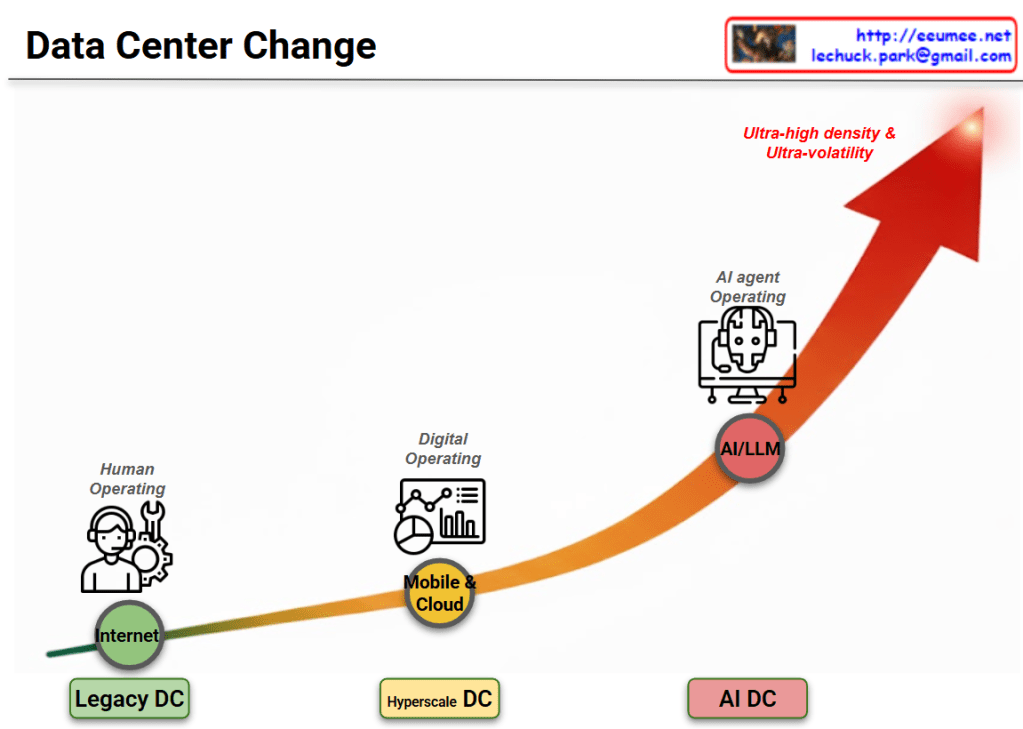
This diagram illustrates the evolutionary progression of infrastructure environments and operational methodologies over time. The upward-pointing arrow indicates the escalating complexity, density, and sophistication of these technologies.
- Phase 1: Internet Era
- Environment: Legacy Data Center
- Core Technology: Internet
- Operating Model: Human Operating
- Characteristics: The foundational stage where human operators physically monitor and control the infrastructure, relying heavily on manual intervention and traditional toolsets.
- Phase 2: Mobile & Cloud Era
- Environment: Hyperscale Data Center
- Core Technology: Mobile & Cloud
- Operating Model: Digital Operating
- Characteristics: A digital transformation phase designed to handle explosive data growth. This stage utilizes dashboards, analytics, and automated systems to significantly improve operational efficiency and scale.
- Phase 3: Artificial Intelligence Era
- Environment: AI Data Center
- Core Technology: AI/LLM (Large Language Models)
- Operating Model: AI Agent Operating
- Characteristics: A highly advanced stage where an AI-driven agent takes over the integrated operations of the platform. It functions autonomously to manage and optimize the system, specifically to cope with the “Ultra-high density & Ultra-volatility” characteristic of modern AI workloads.
Summary
The diagram outlines a fundamental paradigm shift in infrastructure management. It traces the journey from early, manual-heavy environments to digitalized systems, ultimately culminating in an advanced era where an AI-driven agent autonomously manages operations for AI Data Centers, expertly handling environments defined by extreme density and volatility.
#DataCenter #AIAgent #LLM #Hyperscale #DigitalOperating #InfrastructureEvolution #UltraHighDensity #TechTrends
With Gemini