Peak Shaving with Data

Graph Interpretation: Power Peak Shaving in AI Data Centers

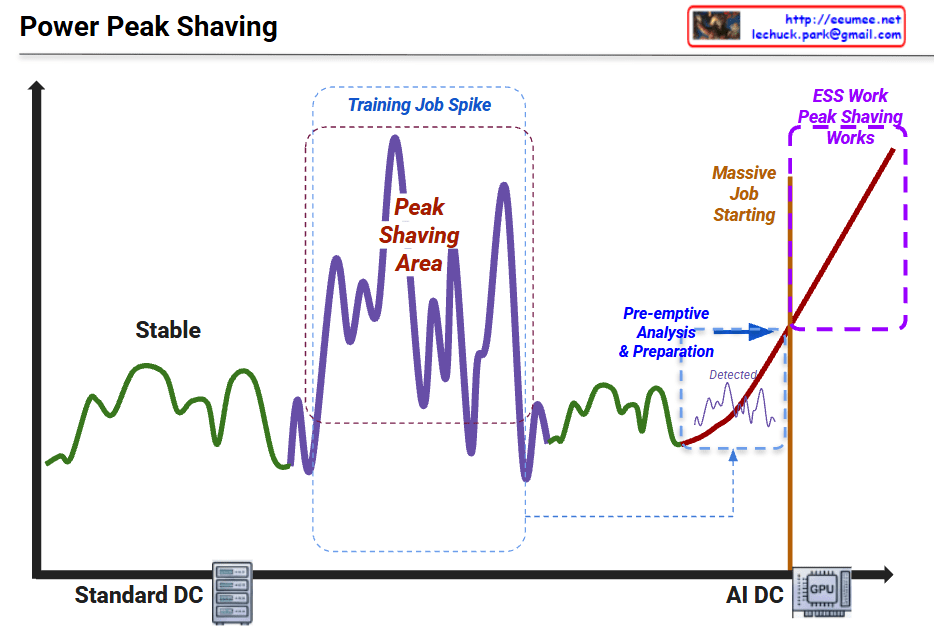
This graph illustrates the shift in power consumption patterns from traditional data centers to AI-driven data centers and the necessity of “Peak Shaving” strategies.

1. Standard DC (Green Line – Left)

  • Characteristics: Shows “Stable” power consumption.
  • Interpretation: Traditional server workloads are relatively predictable with low volatility. The power demand stays within a consistent range.

2. Training Job Spike (Purple Line – Middle)

  • Characteristics: Significant fluctuations labeled “Peak Shaving Area.”
  • Interpretation: During AI model training, power demand becomes highly volatile. The spikes (peaks) and valleys represent the intensive GPU cycles required during training phases.

3. AI DC & Massive Job Starting (Red Line – Right)

  • Characteristics: A sharp, vertical-like surge in power usage.
  • Interpretation: As massive AI jobs (LLM training, etc.) start, the power load skyrockets. The graph shows a “Pre-emptive Analysis & Preparation” phase where the system detects the surge before it hits the maximum threshold.

4. ESS Work & Peak Shaving (Purple Dotted Box – Top Right)

  • The Strategy: To handle the “Massive Job Starting,” the system utilizes ESS (Energy Storage Systems).
  • Action: Instead of drawing all power from the main grid (which could cause instability or high costs), the ESS discharges stored energy to “shave” the peak, smoothing out the demand and ensuring the AI DC operates safely.

Summary

  1. Volatility Shift: AI workloads (GPU-intensive) create much more extreme and unpredictable power spikes compared to standard data center operations.
  2. Proactive Management: Modern AI Data Centers require pre-emptive detection and analysis to prepare for sudden surges in energy demand.
  3. ESS Integration: Energy Storage Systems (ESS) are critical for “Peak Shaving,” providing the necessary power buffer to maintain grid stability and cost efficiency.

#DataCenter #AI #PeakShaving #EnergyStorage #ESS #GPU #PowerManagement #SmartGrid #TechInfrastructure #AIDC #EnergyEfficiency

with Gemini

ML System Engineering

This image illustrates the core pillars of ML System Engineering, outlining the journey from raw data to a responsible, deployed model.


  1. Data Engineering: Data Quality & Skew Prevention
    • Focuses on building robust pipelines to ensure high-quality data. It aims to prevent “training-serving skew,” where the model performs well during training but fails in real-world production due to data inconsistencies.
  2. Model Optimization: Accuracy vs. Efficiency
    • Involves balancing competing metrics such as model size, memory usage, latency, and accuracy. The goal is to optimize models to meet specific hardware constraints without sacrificing predictive performance.
  3. Training Infrastructure: Distributed Training & Convergence
    • Highlights the technical backbone required to scale AI. It focuses on the seamless integration of hardware, data, and algorithms through distributed systems to ensure models converge efficiently and quickly.
  4. Deployment & Operations: MLOps & Edge-to-Cloud
    • Covers the lifecycle of a model in production. MLOps ensures continuous adaptation and monitoring across various environments, from massive Cloud infrastructures to resource-constrained TinyML (edge) devices.
  5. Ethics & Governance: Fairness & Accountability
    • Treats non-functional requirements like fairness, privacy, and transparency as core engineering priorities. It includes “fairness audits” to ensure the AI operates responsibly and remains accountable to its users.

Summary

  • ML System Engineering bridges the gap between theoretical research and real-world production by focusing on data integrity and hardware-aware model optimization.
  • It utilizes MLOps and distributed infrastructure to ensure scalable, continuous deployment across diverse environments, from the Cloud to the Edge.
  • The framework establishes Ethics and Governance as fundamental engineering requirements to ensure AI systems are fair, transparent, and accountable.

#MLSystemEngineering #MLOps #ModelOptimization #DataEngineering #DistributedTraining #TinyML #ResponsibleAI #EdgeComputing #AIGovernance

With Gemini

Peak Shaving


“Power – Peak Shaving” Strategy

The image illustrates a 5-step process for a ‘Peak Shaving’ strategy designed to maximize power efficiency in data centers. Peak shaving is a technique used to reduce electrical load during periods of maximum demand (peak times) to save on electricity costs and ensure grid stability.

1. IT Load & ESS SoC Monitoring

This is the data collection and monitoring phase to understand the current state of the system.

  • Grid Power: Monitoring the maximum power usage from the external power grid.
  • ESS SoC/SoH: Checking the State of Charge (SoC) and State of Health (SoH) of the Energy Storage System (ESS).
  • IT Load (PDU): Measuring the actual load through Power Distribution Units (PDUs) at the server rack level.
  • LLM/GPU Workload: Monitoring the real-time workload of AI models (LLM) and GPUs.

2. ML-based Peak Prediction

Predicting future power demand based on the collected data.

  • Integrated Monitoring: Consolidating data from across the entire infrastructure.
  • Machine Learning Optimization: Utilizing AI algorithms to accurately predict when power peaks will occur and preparing proactive responses.

3. Peak Shaving Via PCS (Power Conversion System)

Utilizing physical energy storage hardware to distribute the power load.

  • Pre-emptive Analysis & Preparation: Determining the “Time to Charge.” The system charges the batteries when electricity rates are low.
  • ESS DC Power: During peak times, the stored Direct Current (DC) in the ESS is converted to Alternating Current (AC) via the PCS to supplement the power supply, thereby reducing reliance on the external grid.

4. Job Relocation (K8s/Slurm)

Adjusting the scheduling of IT tasks based on power availability.

  • Scheduler Decision Engine: Activated when a peak time is detected or when ESS battery levels are low.
  • Job Control: Lower priority jobs are queued or paused, and compute speeds are throttled (power suppressed) to minimize consumption.

5. Parameter & Model Optimization

The most advanced stage, where the efficiency of the AI models themselves is optimized.

  • Real-time Batch Size Adjustment: Controlling throughput to prevent sudden power spikes.
  • Large Model -> sLLM (Lightweight): Transitioning to smaller, lightweight Large Language Models (sLLM) to reduce GPU power consumption without service downtime.

Summary

The core message of this diagram is that High-Quality/High-Resolution Data is the foundation for effective power management. By combining hardware solutions (ESS/PCS), software scheduling (K8s/Slurm), and AI model optimization (sLLM), a data center can significantly reduce operating expenses (OPEX) and ultimately increase profitability (Make money) through intelligent peak shaving.


#AI_DC #PowerControl #DataCenter #EnergyEfficiency #PeakShaving #GreenIT #MachineLearning #ESS #AIInfrastructure #GPUOptimization #Sustainability #TechInnovation

Next AI Computing


The Evolution of AI Computing

The provided images illustrate the architectural shift in AI computing from the traditional “Separation” model to a “Unified” brain-inspired model, focusing on overcoming energy inefficiency and data bottlenecks.

1. CURRENT: The Von Neumann Wall (Separation)

  • Status: The industry standard today.
  • Structure: Computation (CPU/GPU) and Memory (DRAM) are physically separate.
  • Problem: Constant data movement between components creates a “Von Neumann Wall” (bottleneck).
  • Efficiency: Extremely wasteful; 60-80% of energy is consumed just moving data, not processing it.

2. BRIDGE: Processing-In-Memory (PIM) (Proximity)

  • Status: Practical, near-term solution; nearly commercial-ready.
  • Structure: Small processing units are embedded inside the memory.
  • Benefit: Processes data locally to provide a 2-10x efficiency boost.
  • Primary Use: Ideal for accelerating Large Language Models (LLMs).

3. FUTURE: Neuromorphic Computing (Unity)

  • Status: Future-oriented paradigm shift.
  • Structure: Compute IS memory, mimicking the human brain’s architecture where memory elements perform calculations.
  • Benefit: Eliminates data travel entirely, promising a massive 1,000x+ energy improvement.
  • Requirement: Requires a complete overhaul of current software stacks.
  • Primary Use: Ultra-low power Edge devices and Robotics.

#AIComputing #NextGenAI #VonNeumannWall #PIM #ProcessingInMemory #NeuromorphicComputing #EnergyEfficiency #LLM #EdgeAI #Semiconductor #FutureTech #ComputerArchitecture

With Gemini

AI Cost


Strategic Analysis of the AI Cost Chart

1. Hardware (IT Assets): “The Investment Core”

  • Icon: A chip embedded in a complex network web.
  • Key Message: The absolute dominant force, consuming ~70% of the total budget.
  • Details:
    • Compute (The Lead): Features GPU clusters (H100/B200, NVL72). These are not just servers; they represent “High Value Density.”
    • Network (The Hidden Lead): No longer just cabling. The cost of Interconnects (InfiniBand/RoCEv2) and Optics (800G/1.6T) has surged to 15~20%, acting as the critical nervous system of the cluster.

2. Power (Energy): “The Capacity War”

  • Icon: An electric grid secured by a heavy lock (representing capacity security).
  • Key Message: A “Ratio Illusion.” While the percentage (~20%) seems stable due to the skyrocketing hardware costs, the absolute electricity bill has exploded.
  • Details:
    • Load Characteristic: The IT Load (Chip power) dwarfs the cooling load.
    • Strategy: The battle is not just about Efficiency (PUE), but about Availability (Grid Capacity) and Tariff Negotiation.

3. Facility & Cooling: “The Insurance Policy”

  • Icon: A vault holding gold bars (Asset Protection).
  • Key Message: Accounting for ~10% of CapEx, this is not an area for cost-cutting, but for “Premium Insurance.”
  • Details:
    • Paradigm Shift: The facility exists to protect the multi-million dollar “Silicon Assets.”
    • Technology: Zero-Failure is the goal. High-density technologies like DLC (Direct Liquid Cooling) and Immersion Cooling are mandatory to prevent thermal throttling.

4. Fault Cost (Operational Efficiency): “The Invisible Loss”

  • Icon: A broken pipe leaking coins (burning money).
  • Key Message: A “Hidden Cost” that determines the actual success or failure of the business.
  • Details:
    • Metric: The core KPI is MFU (Model Flop Utilization).
    • Impact: Any bottleneck (network stall, storage wait) results in “Stranded Capacity.” If utilization drops to 50%, you are effectively engaging in a “Silent Burn” of 50% of your massive CapEx investment.

💡 Architect’s Note

This chart perfectly illustrates “Why we need an AI DC Operating System.”

“Pillars 1, 2, and 3 (Hardware, Power, Facility) represent the massive capital burned during CONSTRUCTION.

Pillar 4 (Fault Cost) is the battleground for OPERATION.”

Your Operating System is the solution designed to plug the leak in Pillar 4, ensuring that the astronomical investments in Pillars 1, 2, and 3 translate into actual computational value.


Summary

The AI Data Center is a “High-Value Density Asset” where Hardware dominates CapEx (~70%), Power dominates OpEx dynamics, and Facility acts as Insurance. However, the Operational System (OS) is the critical differentiator that prevents Fault Cost—the silent killer of ROI—by maximizing MFU.

#AIDataCenter #AIInfrastructure #GPUUnitEconomics #MFU #FaultCost #DataCenterOS #LiquidCooling #CapExStrategy #TechArchitecture