Time Constant(Delay of the sensor)

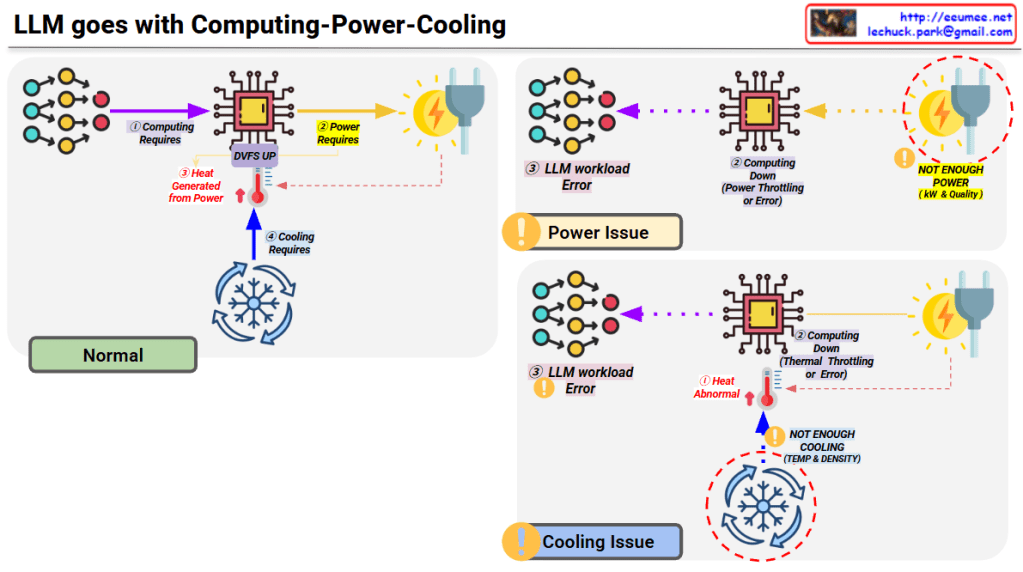
Image Interpretation: System Problems Due to Sensor Delay

This diagram explains system performance issues caused by the Time Constant (delay) of temperature sensors.

Top Section: Two Workload Scenarios

LLM Workload (AI Tasks)

  • Runs at 100% workload
  • Almost no delay (No Delay almost)
  • Result: Performance Down and Workload Cost waste

GPU Workload

  • Operating at 80°C
  • Thermal Throttling occurs
  • Transport Delay exists
  • Performance degradation starts at 60°C → Step down

Bottom Section: Core of the Sensor Delay Problem

Timeline:

  1. Sensor UP start (Temperature Sensor activation)
    • Big Delay due to Time Constant
  2. TC63 (After 10-20 seconds)
    • Sensor detects 63% temperature rise
    • Actual temperature is already higher
  3. After 30-40 seconds
    • Sensor detects 86% rise
    • Temperature Divergence, Late Cooling problem occurs

Key Issues

Due to the sensor’s Time Constant delay:

  • Takes too long to detect actual temperature rise
  • Cooling system activates too late
  • GPU already overheated, causing thermal throttling
  • Results in workload cost waste and performance degradation

Summary

Sensor delays create a critical gap between actual temperature and detected temperature, causing cooling systems to react too late. This results in GPU thermal throttling, performance degradation, and wasted computational resources. Real-time monitoring with fast-response sensors is essential for optimal system performance.


#ThermalManagement #SensorDelay #TimeConstant #GPUThrottling #DataCenter #PerformanceOptimization #CoolingSystem #AIWorkload #SystemMonitoring #HardwareEngineering #ThermalThrottling #LatencyChallenges #ComputeEfficiency #ITInfrastructure #TemperatureSensing

With Claude

LLM goes with Computing-Power-Cooling

LLM’s Computing-Power-Cooling Relationship

This diagram illustrates the technical architecture and potential issues that can occur when operating LLMs (Large Language Models).

Normal Operation (Top Left)

  1. Computing Requires – LLM workload is delivered to the processor
  2. Power Requires – Power supplied via DVFS (Dynamic Voltage and Frequency Scaling)
  3. Heat Generated – Heat is produced during computing processes
  4. Cooling Requires – Temperature management through proper cooling systems

Problem Scenarios

Power Issue (Top Right)

  • Symptom: Insufficient power (kW & Quality)
  • Results:
    • Computing performance degradation
    • Power throttling or errors
    • LLM workload errors

Cooling Issue (Bottom Right)

  • Symptom: Insufficient cooling (Temperature & Density)
  • Results:
    • Abnormal heat generation
    • Thermal throttling or errors
    • Computing performance degradation
    • LLM workload errors

Key Message

For stable LLM operations, the three elements of Computing-Power-Cooling must be balanced. If any one element is insufficient, it leads to system-wide performance degradation or errors. This emphasizes that AI infrastructure design must consider not only computing power but also adequate power supply and cooling systems together.


Summary

  • LLM operation requires a critical balance between computing, power supply, and cooling infrastructure.
  • Insufficient power causes power throttling, while inadequate cooling leads to thermal throttling, both resulting in workload errors.
  • Successful AI infrastructure design must holistically address all three components rather than focusing solely on computational capacity.

#LLM #AIInfrastructure #DataCenter #ThermalManagement #PowerManagement #AIOperations #MachineLearning #HPC #DataCenterCooling #AIHardware #ComputeOptimization #MLOps #TechInfrastructure #AIatScale #GreenAI

WIth Claude

Big Changes with AI

This image illustrates the dramatic growth in computing performance and data throughput from the Internet era to the AI/LLM era.

Key Development Stages

1. Internet Era

  • 10 TWh (terawatt-hours) power consumption
  • 2 PB/day (petabytes/day) data processing
  • 1K DC (1,000 data centers)
  • PUE 3.0 (Power Usage Effectiveness)

2. Mobile & Cloud Era

  • 200 TWh (20x increase)
  • 20,000 PB/day (10,000x increase)
  • 4K DC (4x increase)
  • PUE 1.8 (improved efficiency)

3. AI/LLM (Transformer) Era – “Now Here?” point

  • 400+ TWh (40x additional increase)
  • 1,000,000,000 PB/day = 1 billion PB/day (500,000x increase)
  • 12K DC (12x increase)
  • PUE 1.4 (further improved efficiency)

Summary

The chart demonstrates unprecedented exponential growth in data processing and power consumption driven by AI and Large Language Models. While data center efficiency (PUE) has improved significantly, the sheer scale of computational demands has skyrocketed. This visualization emphasizes the massive infrastructure requirements that modern AI systems necessitate.

#AI #LLM #DataCenter #CloudComputing #MachineLearning #ArtificialIntelligence #BigData #Transformer #DeepLearning #AIInfrastructure #TechTrends #DigitalTransformation #ComputingPower #DataProcessing #EnergyEfficiency