Predictive/Proactive/Reactive

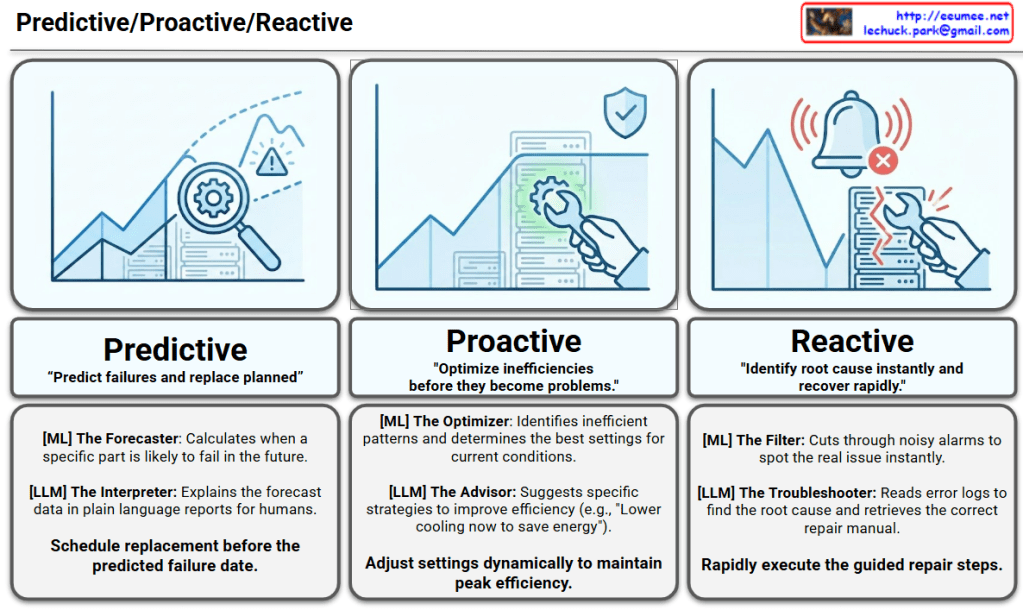
The infographic visualizes how AI technologies (Machine Learning and Large Language Models) are applied across Predictive, Proactive, and Reactive stages of facility management.


1. Predictive Stage

This is the most advanced stage, anticipating future issues before they occur.

  • Core Goal: “Predict failures and replace planned.”
  • Icon Interpretation: A magnifying glass is used to examine a future point on a rising graph, identifying potential risks (peaks and warnings) ahead of time.
  • Role of AI:
    • [ML] The Forecaster: Analyzes historical data to calculate precisely when a specific component is likely to fail in the future.
    • [LLM] The Interpreter: Translates complex forecast data and probabilities into plain language reports that are easy for human operators to understand.
  • Key Activity: Scheduling parts replacement and maintenance windows well before the predicted failure date.

2. Proactive Stage

This stage focuses on optimizing current conditions to prevent problems from developing.

  • Core Goal: “Optimize inefficiencies before they become problems.”
  • Icon Interpretation: On a stable graph, a wrench is shown gently fine-tuning the system for optimization, protected by a shield icon representing preventative measures.
  • Role of AI:
    • [ML] The Optimizer: Identifies inefficient operational patterns and determines the optimal configurations for current environmental conditions.
    • [LLM] The Advisor: Suggests specific, actionable strategies to improve efficiency (e.g., “Lower cooling now to save energy”).
  • Key Activity: Dynamically adjusting system settings in real-time to maintain peak efficiency.

3. Reactive Stage

This stage deals with responding rapidly and accurately to incidents that have already occurred.

  • Core Goal: “Identify root cause instantly and recover rapidly.”
  • Icon Interpretation: A sharp drop in the graph accompanied by emergency alarms, showing an urgent repair being performed on a broken server rack.
  • Role of AI:
    • [ML] The Filter: Cuts through the noise of massive alarm volumes to instantly isolate the true, critical issue.
    • [LLM] The Troubleshooter: Reads and analyzes complex error logs to determine the root cause and retrieves the correct Standard Operating Procedure (SOP) or manual.
  • Key Activity: Rapidly executing the guided repair steps provided by the system.

Summary

  • The image illustrates the evolution of data center operations from traditional Reactive responses to intelligent Proactive optimization and Predictive maintenance.
  • It clearly delineates the roles of AI, where Machine Learning (ML) handles data analysis and forecasting, while Large Language Models (LLMs) interpret these insights and provide actionable guidance.
  • Ultimately, this integrated AI approach aims to maximize uptime, enhance energy efficiency, and accelerate incident recovery in critical infrastructure.

#DataCenter #AIOps #PredictiveMaintenance #SmartInfrastructure #ArtificialIntelligence #MachineLearning #LLM #FacilityManagement #ITOps

with Gemini

AI DC Power Risk


Technical Analysis: AI Load & Weak Grid Interaction

The integration of massive AI workloads into a Weak Grid (SCR:Short Circuit Ratio < 3) creates a high-risk environment where electrical Transients can escalate into systemic failures.

1. Voltage Dip (Transient Voltage Sag)

  • Mechanism: AI workloads are characterized by Step Power Changes and Pulse-type Profiles. When these massive loads activate simultaneously, they cause an immediate Transient Voltage Sag in a weak grid due to high impedance.
  • Impact: This compromises Power Quality, leading to potential malfunctions in voltage-sensitive AI hardware.

2. Load Drop (Transient Load Rejection)

  • Mechanism: If the voltage sag exceeds safety thresholds, protection systems trigger Load Rejection, causing the power consumption to plummet to zero (P -> 0).
  • Impact: This results in Service Downtime and creates a massive power imbalance in the grid, often referred to as Load Shedding.

3. Snap-back (Transient Recovery & Inrush)

  • Mechanism: As the grid attempts to recover or the load is re-engaged, it creates a Transient Recovery Voltage (TRV).
  • Impact: This phase often sees Overvoltage (Overshoot) and a massive Surge Inflow (Inrush Current), which places extreme electrical stress on power components and can damage sensitive circuitry.

4. Instability (Dynamic & Harmonic Oscillation)

  • Mechanism: The repetition of sags and surges leads to Dynamic Oscillation. The control systems of power converters may lose synchronization with the grid frequency.
  • Impact: The result is severe Waveform Distortion, Loss of Control, and eventually a total Grid Collapse (Blackout).

Key Insight (NERC 2025 Warning)

The North American Electric Reliability Corporation (NERC) warns that the reduction of voltage-sensitive loads and the rise of periodic, pulse-like AI workloads are primary drivers of modern grid instability.


Summary

  1. AI Load Dynamics: Rapid step-load changes in AI data centers act as a “shock” to weak grids, triggering a self-reinforcing cycle of electrical failure.
  2. Transient Progression: The cycle moves from a Voltage Sag to a Load Trip, followed by a damaging Power Surge, eventually leading to non-damped Oscillations.
  3. Strategic Necessity: To break this cycle, data centers must implement advanced solutions like Grid-forming Inverters or Fast-acting BESS to provide synthetic inertia and voltage support.

#PowerTransients #WeakGrid #AIDataCenter #GridStability #NERC2025 #VoltageSag #LoadShedding #ElectricalEngineering #AIInfrastructure #SmartGrid #PowerQuality

With Gemini

CAPEX & OPEX

1. Definitions (The Pillars)

  • CAPEX (Capital Expenditures): Upfront investments for physical assets (e.g., hardware, infrastructure) to create future value.
  • OPEX (Operating Expenses): Ongoing costs required to run the day-to-day operations (e.g., maintenance, utilities, subscriptions).

2. The Economic Logic

  • Trade-off: There is a natural tension between the two; higher upfront investment (CAPEX) can lower future operating costs (OPEX), and vice versa.
  • Law of Diminishing Returns: This graph warns that striving for 100% perfection in optimization yields progressively smaller benefits relative to the effort and cost invested.

3. Strategic Conclusion: The 80% Rule

  • The infographic proposes a pragmatic “Start Point.”
  • Instead of delaying for perfection, it suggests that achieving 80% readiness in CAPEX and 80% efficiency in OPEX is the sweet spot. This balance allows for a timely launch without falling into the trap of diminishing returns.

Summary

  1. While CAPEX and OPEX involve a necessary trade-off, striving for 100% optimization in both leads to diminishing returns.
  2. Over-optimization drains resources and delays execution without proportional gains.
  3. The most efficient strategy is to define the “Start Point” at 80% readiness for both, favoring speed and agility over perfection.

#CAPEXvsOPEX #BusinessStrategy #CostOptimization #DiminishingReturns #TechInfrastructure #OperationalEfficiency #Infographic #TechVisualizer #DecisionMaking

Event Processing

This diagram illustrates a workflow that handles system logs/events by dividing them into real-time urgent responses and periodic deep analysis.

1. Data Ingestion & Filtering

  • Event Log → One-time Event Noti: The process begins with incoming event logs triggering an initial, single-instance notification.
  • Hot Event Decision: A decision node determines if the event is critical (“Hot Event?”). This splits the workflow into two distinct paths: a Hot Path for emergencies and an Analytical Path for deeper insights.

2. Hot Path (Real-time Response)

  • Urgent Event Noti & Analysis: If identified as a “Hot Event,” the system immediately issues an urgent notification and performs an urgent analysis while persisting the data to the database. This path appears designed to minimize MTTD (Mean Time To Detect) for critical failures.

3. Periodic & Contextual Analysis (AIOps Layer)

This section indicates a shift from simple monitoring to intelligent AIOps.

  • Periodic Analysis: Events are aggregated and analyzed over fixed time windows (1 min, 1 Hour, 1 Day). The purple highlight on “1 min” suggests the current focus is on short-term trend analysis.
  • Contextual Similarity Search: This is a critical advanced feature. By explicitly mentioning “Embedding / Indexing,” the architecture suggests the use of Vector Search (likely via a Vector DB). It implies the system doesn’t just match keywords but understands the semantic context of an error to find similar past cases.
  • Historical Co-relation Analysis: This module synthesizes the periodic trends and similarity search results to correlate the current event with historical patterns, aiding in Root Cause Analysis (RCA).

4. User Interface (UI/UX)

The processed insights are delivered to the user through four channels:

  • Dashboard: High-level status visualization.
  • Notification: Alerts for urgent issues.
  • Report: Summarized periodic findings.
  • Search & Analysis Tool: A tool for granular log investigation.

Summary

  1. Hybrid Architecture: Efficiently separates critical “Hot Event” handling (Real-time) from deep “Periodic Analysis” (Batch) to balance speed and insight.
  2. Semantic Intelligence: Incorporates “Contextual Similarity Search” using Embeddings, enabling the system to identify issues based on meaning rather than just keywords.
  3. Holistic Observability: interconnected modules (Urgent, Periodic, Historical) feed into a comprehensive UI/UX to support rapid decision-making and post-mortem analysis.

#EventProcessing #SystemArchitecture #VectorSearch #Observability #RCA

Power-Driven Predictive Cooling Control (Without Server Telemetry)

For a Co-location (Colo) service provider, the challenge is managing high-density AI workloads without having direct access to the customer’s proprietary server data or software stacks. This second image provides a specialized architecture designed to overcome this “data blindness” by using infrastructure-level metrics.


1. The Strategy: Managing the “Black Box”

In a co-location environment, the server internal data—such as LLM Job Schedules, GPU/HBM telemetry, and Internal Temperatures—is often restricted for security and privacy reasons. This creates a “Black Box” for the provider. The architecture shown here shifts the focus from the Server Inside to the Server Outside, where the provider has full control and visibility.

2. Power as the Primary Lead Indicator

Because the provider cannot see when an AI model starts training, they must rely on Power Supply telemetry as a proxy.

  • The Power-Heat Correlation: As indicated by the red arrow, there is a near-instantaneous correlation between GPU activity and power draw ($kW$).
  • Zero-Inference Monitoring: By monitoring Power Usage & Trends at the PDU (Power Distribution Unit) level, the provider can detect a workload spike the moment it happens, often several minutes before the heat actually migrates to the rack-level sensors.

3. Bridging the Gap with ML Analysis

Since the provider is missing the “More Proactive” software-level data, the Analysis with ML component becomes even more critical.

  • Predictive Modeling: The ML engine analyzes power trends to forecast the thermal discharge. It learns the specific “power signature” of AI workloads, allowing it to initiate a Cooling Response (adjusting Flow Rate in LPM and $\Delta T$) before the ambient temperature rises.
  • Optimization without Intrusion: This allows the provider to maintain a strict SLA (Service Level Agreement) and optimize PUE (Power Usage Effectiveness) without requiring the tenant to install agents or share sensitive job telemetry.

Comparison for Co-location Providers

FeatureIdeal Model (Image 1)Practical Colo Model (Image 2)
VisibilityFull-stack (Software to Hardware)Infrastructure-only (Power & Air/Liquid)
Primary MetricLLM Job Queue / GPU TempPower Trend ($kW$) / Rack Density
Tenant PrivacyLow (Requires data sharing)High (Non-intrusive)
Control PrecisionExtremely HighHigh (Dependent on Power Sampling Rate)

Summary

  1. For Co-location providers, this architecture solves the lack of server-side visibility by using Power Usage ($kW$) as a real-time proxy for heat generation.
  2. By monitoring Power Trends at the infrastructure level, the system can predict thermal loads and trigger Cooling Responses before temperature sensors even react.
  3. This ML-driven approach enables high-efficiency cooling and PUE optimization while respecting the strict data privacy and security boundaries of multi-tenant AI data centers.

Hashtags

#Colocation #DataCenterManagement #PredictiveCooling #AICooling #InfrastructureOptimization #PUE #LiquidCooling #MultiTenantSecurity

With Gemini