AI Infrastructure Architect & Technical Visualizer "Complex Systems, Simplified. I translate massive AI infrastructure into visual intelligence." I love to learn computer tech and help people by the digital.
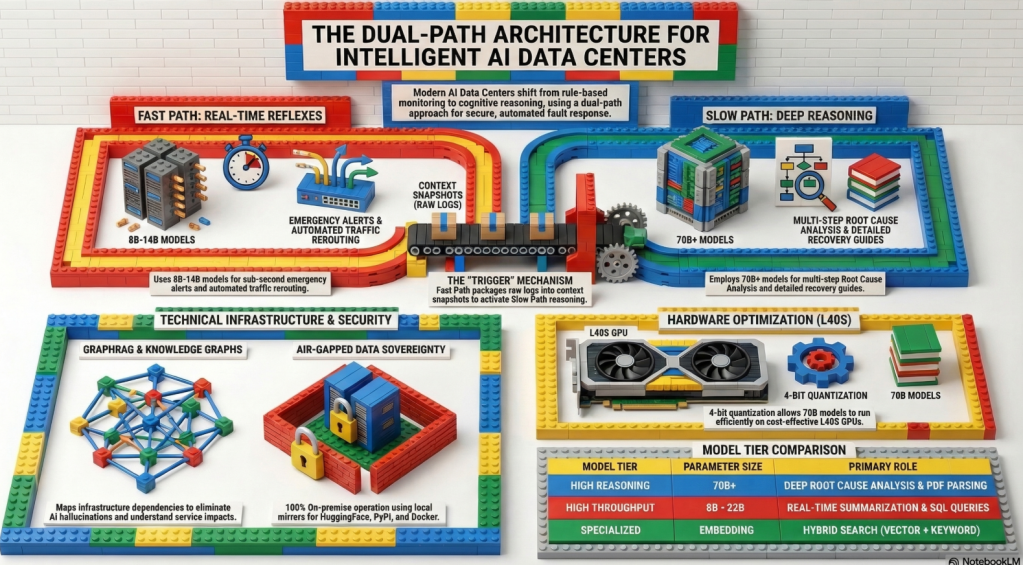
The proposed AI DC Intelligent Incident Response Platform upgrades traditional data center monitoring to an “Autonomous Operations” system within a secure, air-gapped on-premise environment. It features a Dual-Path architecture that utilizes lightweight LLMs for real-time automated alerts (Fast Path) and high-performance LLMs with GraphRAG for deep root-cause analysis (Slow Path). By structuring fragmented manuals and comprehensively mapping infrastructure dependencies, this system significantly reduces recovery time (MTTR) and provides a highly scalable, cost-effective solution for hyper-scale AI data centers
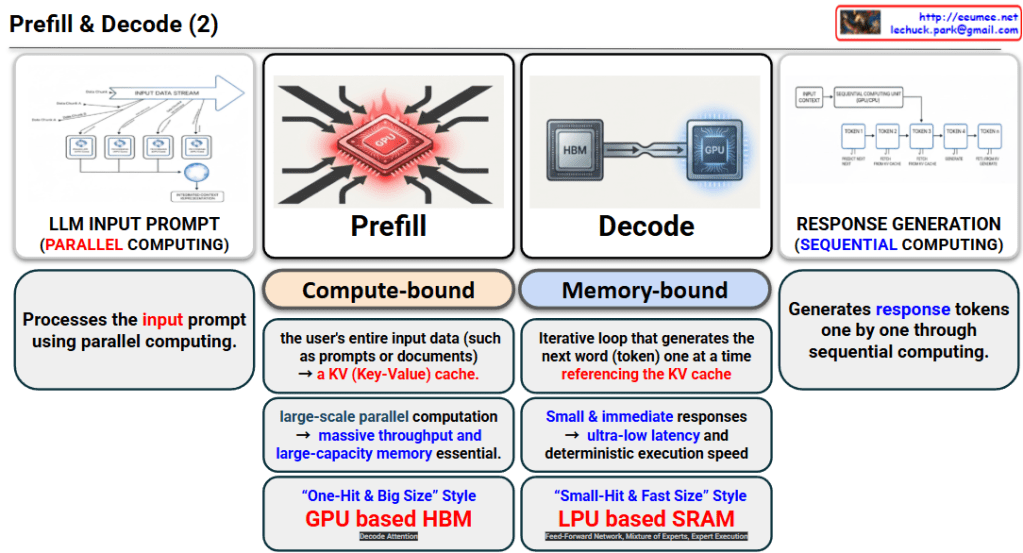
Processing Method: It processes the user’s lengthy prompts or documents all at once using Parallel Computing.
Bottleneck (Compute-bound): Since it needs to process a massive amount of data simultaneously, computational power is the most critical factor. This phase generates the KV (Key-Value) cache which is used in the next step.
Requirements: Because it requires large-scale parallel computation, massive throughput and large-capacity memory are essential.
Hardware Characteristics: The image describes this as a “One-Hit & Big Size” style, explaining that a GPU-based HBM (High Bandwidth Memory) architecture is highly suitable for handling such large datasets.
2. Decode Phase (Sequential Token Generation)
Processing Method: Using the KV cache generated during the Prefill phase, this is a Sequential Computing process that generates the response tokens one by one.
Bottleneck (Memory-bound): The computation itself is light, but the system must constantly access the memory (KV cache) to fetch and generate the next word. Therefore, memory access speed (bandwidth) becomes the limiting factor.
Requirements: Because it needs to provide small and immediate responses to the user, ultra-low latency and deterministic execution speed are crucial.
Hardware Characteristics: Described as a “Small-Hit & Fast Size” style, an LPU (Language Processing Unit)-based SRAM architecture is highly advantageous to minimize latency.
💡Summary
Prefill is a compute-bound phase that processes user input in parallel all at once to create a KV cache, making GPU and HBM architectures highly suitable.
Decode is a memory-bound phase that sequentially generates words one by one by referencing the KV cache, where LPU and SRAM architectures are advantageous for achieving ultra-low latency.
Ultimately, an LLM operates by grasping the context through large-scale computation (Prefill) and then generating responses in real-time through fast memory access (Decode).
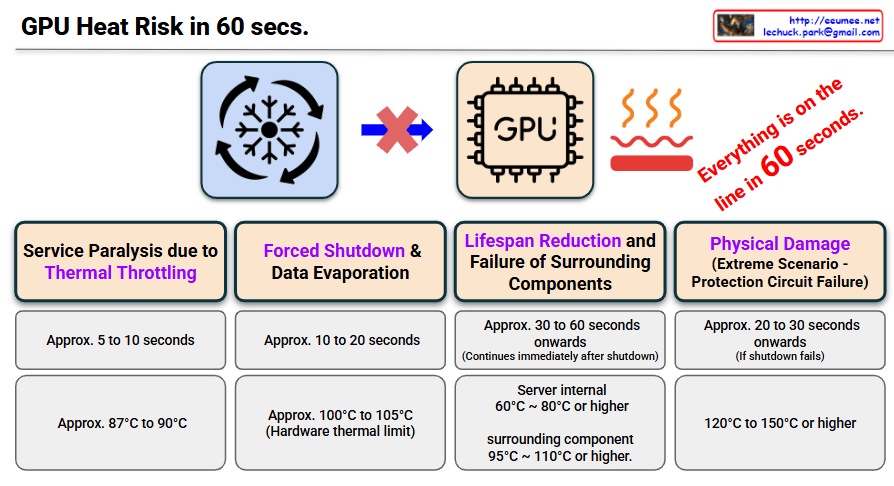
The left side depicts a scenario where a normal cooling system (fan icon) completely stops functioning, indicated by the red “X” and arrow.
This flow visually demonstrates that the GPU chip on the right is immediately exposed to uncontrollable heat (represented by the red heat waves and the red bar at the bottom).
The powerful slogan on the right, “Everything is on the line in 60 seconds,” serves as a stark warning that all infrastructure and data are at critical risk if no action is taken within one minute.
2. Four Critical Stages of Damage Over Time (Bottom Table)
The slide neatly structures each stage based on elapsed time and risk level. Highlighting the core damage elements in purple effectively draws the audience’s attention to the most critical impacts.
Stage 1 (Approx. 5 to 10 seconds): Service Paralysis due to Thermal Throttling
Temperature: Approx. 87°C to 90°C
Impact: Due to the rapid temperature spike, the GPU automatically throttles its performance, causing immediate service paralysis.
Stage 2 (Approx. 10 to 20 seconds): Forced Shutdown & Data Evaporation
Temperature: Approx. 100°C to 105°C (Hardware thermal limit)
Impact: Power is forcibly cut to protect the hardware, resulting in the permanent evaporation of unsaved checkpoint data.
Stage 3 (Approx. 30 to 60 seconds onwards): Lifespan Reduction and Failure of Surrounding Components
Impact: Even after the shutdown, massive residual heat trapped in the rack acts like an oven, severely reducing the lifespan of surrounding components (memory, cables, VRMs) and causing future failures.
Impact: In the worst-case scenario where protection circuits fail, the GPU chip and board physically burn out, leading to permanent hardware destruction.
This slide clearly demonstrates that human intervention is simply too slow to stop thermal runaway in high-density environments. It provides a compelling justification for deploying an intelligent, automated solution that can monitor systems second-by-second and execute immediate emergency protocols.
A total cooling failure in a high-density GPU environment leads to critical service throttling and data loss within a mere 10 to 20 seconds.
Even after a forced shutdown, trapped residual heat continues to severely damage surrounding components, drastically reducing infrastructure lifespan.
This extremely narrow 60-second window proves that human intervention is impossible, making an automated, immediate emergency response agent absolutely essential.
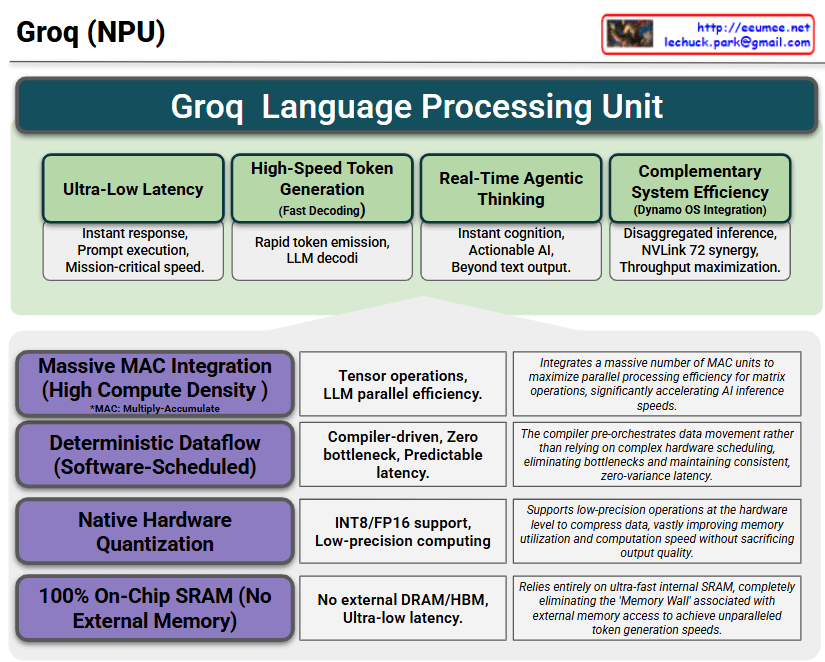
The core strength of this slide is how it connects the Capabilities/Benefits (The “What”) at the top with the Core Technologies (The “How”) at the bottom.
1. Top Section (Green): The Capabilities & Benefits of LPU
This section highlights the immediate, tangible values achieved by deploying the Groq architecture.
Ultra-Low Latency & High-Speed Token Gen: Emphasizes the crucial need for instant response times and rapid LLM decoding for real-time services. (Note: There is a minor typo in the second box—”decodi” should be “decoding”.)
Real-Time Agentic Thinking: Shows that this speed elevates the AI from a simple text generator to an actionable agent capable of instant cognition.
Complementary System Efficiency: Highlights the strategic advantage of “Disaggregated Inference,” where the LPU handles fast generation while partnering with high-throughput systems (like NVLink 72) to maximize the overall data center throughput.
2. Bottom Section (Grey): The 4 Core Technologies
This section details the specific engineering choices that make the top section’s performance possible.
Massive MAC Integration: The sheer density of compute units required for parallel tensor operations.
Deterministic Dataflow: The software/compiler-driven approach that eliminates hardware scheduling bottlenecks, ensuring predictable, zero-variance latency.
Native Hardware Quantization: The built-in support for low-precision formats (INT8/FP16) to speed up math and save memory.
100% On-Chip SRAM: The most critical differentiator—completely bypassing external memory (DRAM/HBM) to shatter the “Memory Wall.”
Summary
Logical Architecture: The slide perfectly visualizes how four radical hardware design choices directly enable four critical performance benefits for AI inference.
The Speed Secret: It highlights that Groq’s unprecedented speed and predictable latency come from eliminating external memory (100% SRAM) and relying on software-scheduled dataflow.
System Synergy: It effectively positions the LPU not as a standalone replacement, but as a specialized engine for real-time agentic thinking that complements high-throughput data center systems.
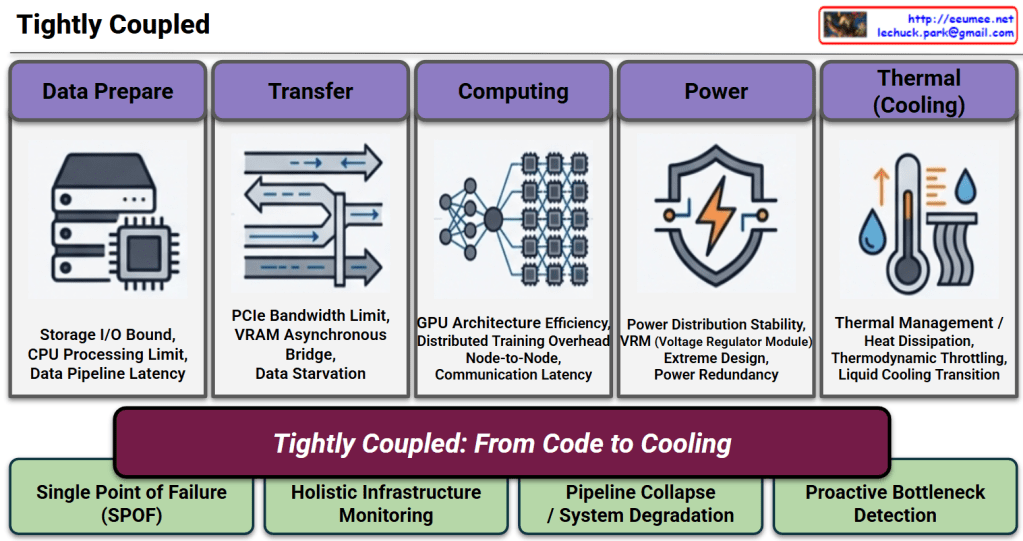
1. The 5 Pillars & Potential Bottlenecks (Top Section)
The Flow: The diagram visualizes the critical path of an AI workload, moving sequentially through Data Prepare ➔ Transfer ➔ Computing ➔ Power ➔ Thermal (Cooling).
The Risks: Below each pillar, specific technical bottlenecks are listed (e.g., Storage I/O Bound, PCIe Bandwidth Limit, Thermodynamic Throttling). This highlights that each stage is highly sensitive; a delay or failure in any single component can starve the GPU or cause system-wide degradation.
2. The Core Message (Center Section)
The Banner: The central phrase, “Tightly Coupled: From Code to Cooling”, acts as the heart of the presentation. It boldly declares that AI infrastructure is no longer divided into “IT” and “Facilities.” Instead, it is a single, inextricably linked ecosystem where the execution of a single line of code directly translates to immediate physical power and cooling demands.
The Reality (Left): Because the system is so interdependent, any Single Point of Failure (SPOF) will lead to a complete Pipeline Collapse / System Degradation.
The Operational Shift (Right): To prevent this, traditional siloed management must be replaced. The slide strongly argues for Holistic Infrastructure Monitoring and Proactive Bottleneck Detection. It visually proves that reacting to issues after they happen is too late; operations must be predictive and unified across the entire stack.
💡Summary
Interdependence: AI data centers operate as a single, highly sensitive organism where one isolated bottleneck can collapse the entire computational pipeline.
Paradigm Shift: The tight coupling of software workloads and physical facilities (“From Code to Cooling”) makes legacy, reactive monitoring obsolete.
Strategic Imperative: To ensure stability and efficiency, operations must transition to holistic, proactive detection driven by intelligent, autonomous management solutions.