This illustration visualizes the evolution of data centers, contrasting the traditionally separated components with the modern AI data center where software, compute, network, and crucially, power and cooling systems are ‘tightly fused’ together. It emphasizes how power and advanced cooling are organically intertwined with GPU and memory, directly impacting AI performance and highlighting their inseparable role in meeting the demands of high-performance AI. This tight integration symbolizes a pivotal shift for the modern AI era.
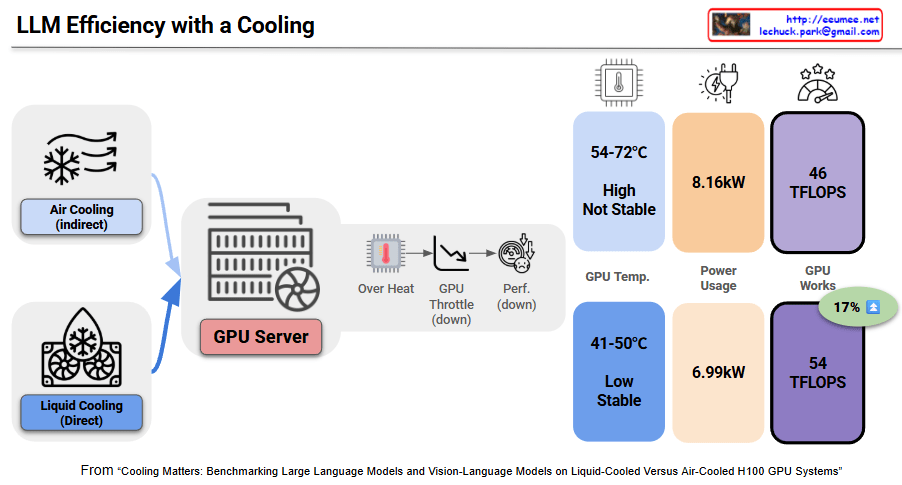
This image demonstrates the critical impact of cooling stability on both LLM performance and energy efficiency in GPU servers through benchmark results.
Cascading Effects of Unstable Cooling
Problems with Unstable Air Cooling:
GPU Temperature: 54-72°C (high and unstable)
Thermal throttling occurs – where GPUs automatically reduce clock speeds to prevent overheating, leading to significant performance degradation
Result: Double penalty of reduced performance + increased power consumption
Energy Efficiency Impact:
Power Consumption: 8.16kW (high)
Performance: 46 TFLOPS (degraded)
Energy Efficiency: 5.6 TFLOPS/kW (poor performance-to-power ratio)
Benefits of Stable Liquid Cooling
Temperature Stability Achievement:
GPU Temperature: 41-50°C (low and stable)
No thermal throttling → sustained optimal performance
Energy Efficiency Improvement:
Power Consumption: 6.99kW (14% reduction)
Performance: 54 TFLOPS (17% improvement)
Energy Efficiency: 7.7 TFLOPS/kW (38% improvement)
Core Mechanisms: How Cooling Affects Energy Efficiency
Power Efficiency Optimization: Eliminates inefficient power consumption caused by overheating
Performance Consistency: Unstable cooling can cause GPUs to use 50% of power budget while delivering only 25% performance
Advanced cooling systems can achieve energy savings ranging from 17% to 23% compared to traditional methods. This benchmark paradoxically shows that proper cooling investment dramatically improves overall energy efficiency.
Final Summary
Unstable cooling triggers thermal throttling that simultaneously degrades LLM performance while increasing power consumption, creating a dual efficiency loss.Stable liquid cooling achieves 17% performance gains and 14% power savings simultaneously, improving energy efficiency by 38%.In AI infrastructure, adequate cooling investment is essential for optimizing both performance and energy efficiency.
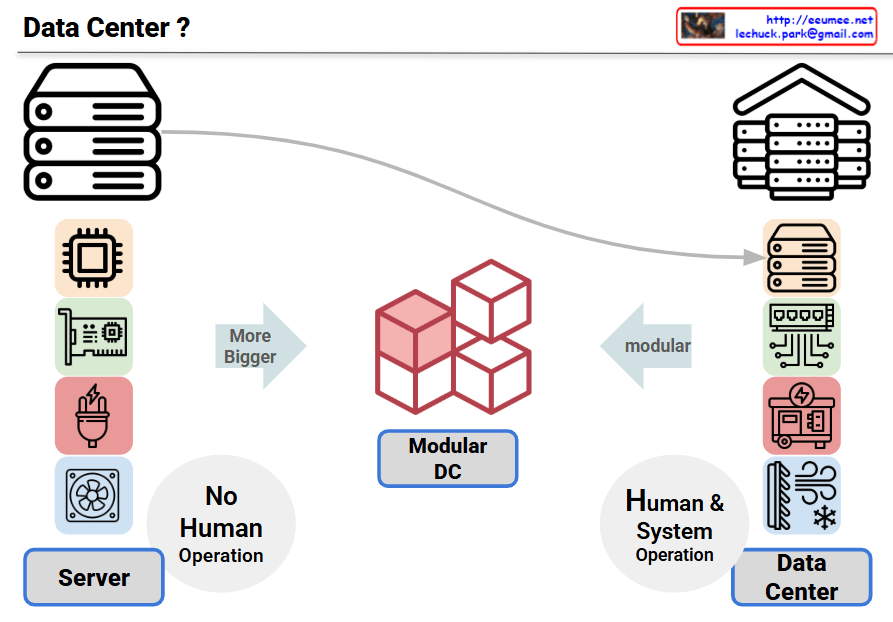
This infographic compares the evolution from servers to data centers, showing the progression of IT infrastructure complexity and operational requirements.
Left – Server
Shows individual hardware components: CPU, motherboard, power supply, cooling fans
Labeled “No Human Operation,” indicating basic automated functionality
Center – Modular DC
Represented by red cubes showing modular architecture
Emphasizes “More Bigger” scale and “modular” design
Represents an intermediate stage between single servers and full data centers
Right – Data Center
Displays multiple server racks and various infrastructure components (networking, power, cooling systems)
Marked as “Human & System Operation,” suggesting more complex management requirements
Additional Perspective on Automation Evolution:
While the image shows data centers requiring human intervention, the actual industry trend points toward increasing automation:
Advanced Automation: Large-scale data centers increasingly use AI-driven management systems, automated cooling controls, and predictive maintenance to minimize human intervention.
Lights-Out Operations Goal: Hyperscale data centers from companies like Google, Amazon, and Microsoft ultimately aim for complete automated operations with minimal human presence.
Paradoxical Development: As scale increases, complexity initially requires more human involvement, but advanced automation eventually enables a return toward unmanned operations.
Summary: This diagram illustrates the current transition from simple automated servers to complex data centers requiring human oversight, but the ultimate industry goal is achieving fully automated “lights-out” data center operations. The evolution shows increasing complexity followed by sophisticated automation that eventually reduces the need for human intervention.
This diagram illustrates the thermodynamic principles and calculation methods for cooling systems, particularly relevant for data center and server room thermal management.
System Components
Left Side (Heat Generation)
Power consumption device (Power kW)
Time element (Time kWh)
Heat-generating source (appears to be server/computer systems)
Right Side (Cooling)
Cooling system (Cooling kW – Remove ‘Heat’)
Cooling control system
Coolant circulation system
Core Formula: Q = m×Cp×ΔT
Heat Generation Side (Red Box)
Q: Heat flow rate (J/s) = Power (kW)
V: Volumetric flow rate (m³/s)
ρ: Air density (approximately 1.2 kg/m³)
Cp: Specific heat capacity of air at constant pressure (approximately 1005 J/(kg·K))
ΔT: Temperature change
Cooling Side (Blue Box)
Q: Cooling capacity (kW)
m: Coolant circulation rate (kg/s)
Cp: Specific heat capacity of coolant (for water, approximately 4.2 kJ/kg·K)
ΔT: Temperature change
System Operation Principle
Heat generated by electronic equipment heats the air
Heated air moves to the cooling system
Circulating coolant absorbs the heat
Cooling control system regulates flow rate or temperature
Processed cool air recirculates back to the system
Key Design Considerations
The cooling control system monitors critical parameters such as:
High flow rate vs. High temperature differential
Optimal balance between energy efficiency and cooling effectiveness
Heat load matching between generation and removal capacity
Summary
This diagram demonstrates the fundamental thermodynamic principles for cooling system design, where electrical power consumption directly translates to heat generation that must be removed by the cooling system. The key relationship Q = m×Cp×ΔT applies to both heat generation (air side) and heat removal (coolant side), enabling engineers to calculate required coolant flow rates and temperature differentials. Understanding these heat balance calculations is essential for efficient thermal management in data centers and server environments, ensuring optimal performance while minimizing energy consumption.
This diagram visualizes the core concept that all components must be organically connected and work together to successfully operate AI workloads.
Importance of Organic Interconnections
Continuity of Data Flow
The data pipeline from Big Data → AI Model → AI Workload must operate seamlessly
Bottlenecks at any stage directly impact overall system performance
Cooperative Computing Resource Operations
GPU/CPU computational power must be balanced with HBM memory bandwidth
SSD I/O performance must harmonize with memory-processor data transfer speeds
Performance degradation in one component limits the efficiency of the entire system
Integrated Software Control Management
Load balancing, integration, and synchronization coordinate optimal hardware resource utilization
Real-time optimization of workload distribution and resource allocation
Infrastructure-based Stability Assurance
Stable power supply ensures continuous operation of all computing resources
Cooling systems prevent performance degradation through thermal management of high-performance hardware
Facility control maintains consistency of the overall operating environment
Key Insight
In AI systems, the weakest link determines overall performance. For example, no matter how powerful the GPU, if memory bandwidth is insufficient or cooling is inadequate, the entire system cannot achieve its full potential. Therefore, balanced design and integrated management of all components is crucial for AI workload success.
The diagram emphasizes that AI infrastructure is not just about having powerful individual components, but about creating a holistically optimized ecosystem where every element supports and enhances the others.
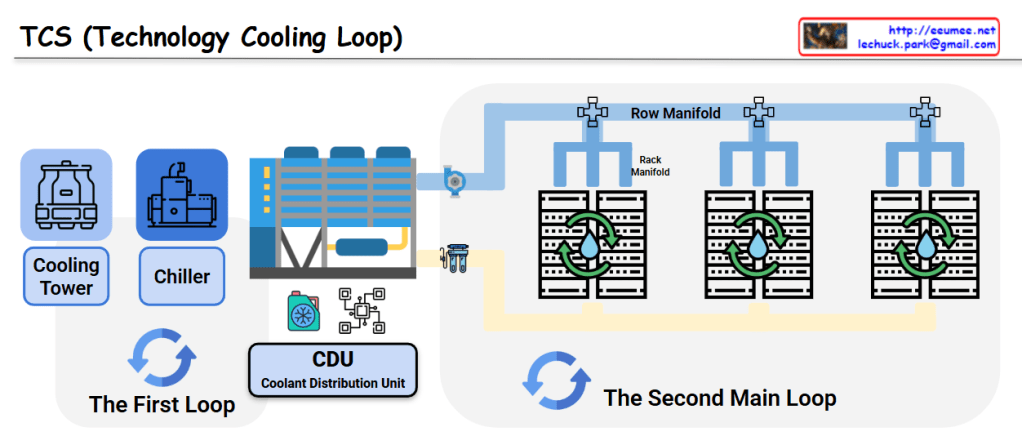
This image shows a diagram of the TCS (Technology Cooling Loop) system structure.
System Components
The First Loop:
Cooling Tower: Dissipates heat to the atmosphere
Chiller: Generates chilled water
CDU (Coolant Distribution Unit): Distributes coolant throughout the system
The Second Main Loop:
Row Manifold: Distributes cooling water to each server rack row
Rack Manifold: Individual rack-level cooling water distribution system
Server Racks: IT equipment racks that require cooling
System Operation
Primary Loop: The cooling tower releases heat to the outside air, while the chiller produces chilled water that is supplied to the CDU
Secondary Loop: Coolant distributed from the CDU flows through the Row Manifold to each server rack’s Rack Manifold, cooling the servers
Circulation System: The heated coolant returns to the CDU where it is re-cooled through the primary loop
This is an efficient cooling system used in data centers and large-scale IT facilities. It systematically removes heat generated by server equipment to ensure stable operations through a two-loop architecture that separates the heat rejection process from the precision cooling delivery to IT equipment.
This diagram illustrates a server room thermal management system workflow.
System Architecture
Server Internal Components:
AI Workload, GPU Workload, and Power Workload are connected to the CPU, generating heat
Temperature Monitoring Points:
Supply Temp: Cold air supplied from the cooling system
CoolZone Temp: Temperature in the cooling zone
Inlet Temp: Server inlet temperature
Outlet Temp: Server outlet temperature
Hot Zone Temp: Temperature in the heat exhaust zone
Return Temp : Hot air return to the cooling system
Cooling System:
The Cooling Workload on the left manages overall cooling
Closed-loop cooling system that circulates back via Return Temp
Temperature Delta Monitoring
The bottom flowchart shows how each workload affects temperature changes (ΔT):
Delta temperature sensors (Δ1, Δ2, Δ3) measure temperature differences across each section
This data enables analysis of each workload’s thermal impact and optimization of cooling efficiency
This system appears to be a data center thermal management solution designed to effectively handle high heat loads from AI and GPU-intensive workloads. The comprehensive temperature monitoring allows for precise control and optimization of the cooling infrastructure based on real-time workload demands.