Data Center Shift with AI
This diagram illustrates how data centers are transforming as they enter the AI era.
📅 Timeline of Technological Evolution
The top section shows major technology revolutions and their timelines:
- Internet ’95 (Internet era)
- Mobile ’07 (Mobile era)
- Cloud ’10 (Cloud era)
- Blockchain
- AI(LLM) ’22 (Large Language Model-based AI era)
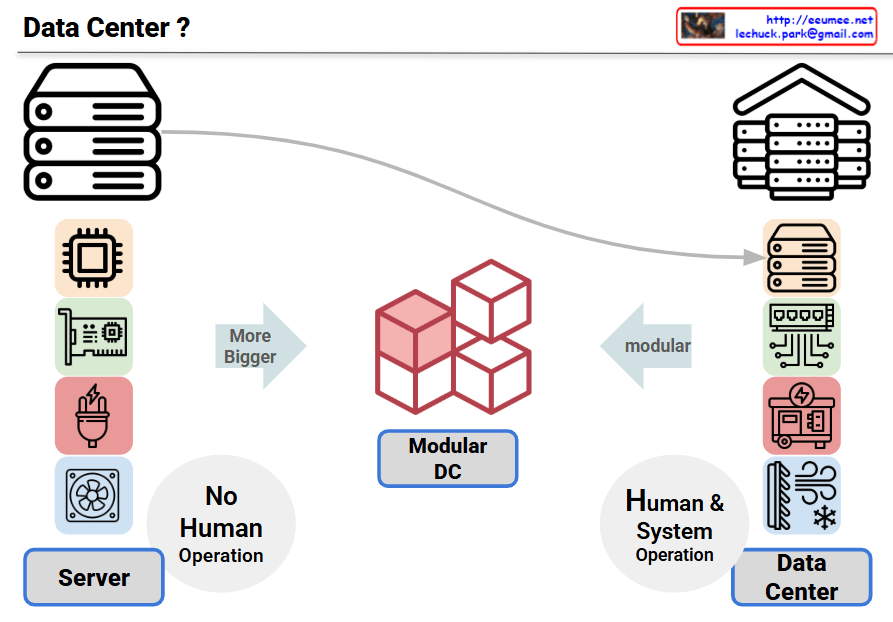
🏢 Traditional Data Center Components
Conventional data centers consisted of the following core components:
- Software
- Server
- Network
- Power
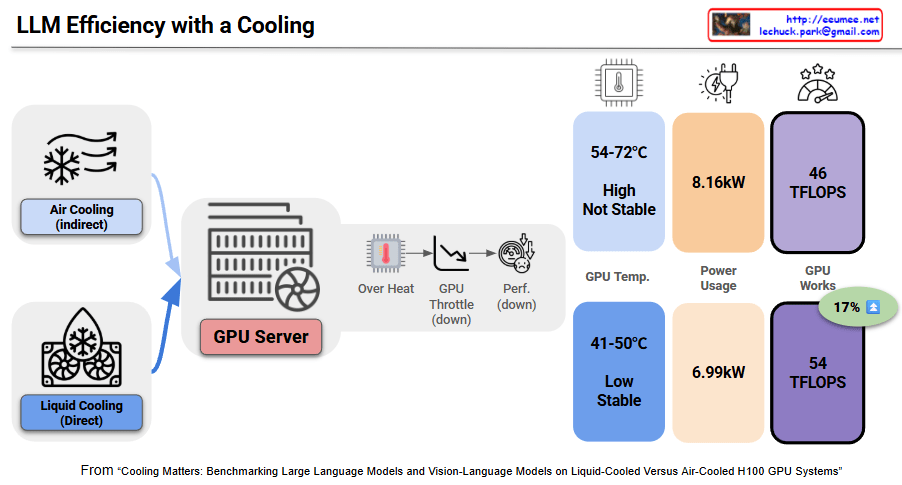
- Cooling
These were designed as relatively independent layers.
🚀 New Requirements in the AI Era
With the introduction of AI (especially LLMs), data centers require specialized infrastructure:
- LLM Model – Operating large language models
- GPU – High-performance graphics processing units (essential for AI computations)
- High B/W – High-bandwidth networks (for processing large volumes of data)
- SMR/HVDC – Switched-Mode Rectifier/High-Voltage Direct Current power systems
- Liquid/CDU – Liquid cooling/Cooling Distribution Units (for cooling high-heat GPUs)
🔗 Key Characteristic of AI Data Centers: Integrated Design
The circular connection in the center of the diagram represents the most critical feature of AI data centers:
Tight Interdependency between SW/Computing/Network ↔ Power/Cooling
Unlike traditional data centers, in AI data centers:
- GPU-based computing consumes enormous power and generates significant heat
- High B/W networks consume additional power during massive data transfers between GPUs
- Power systems (SMR/HVDC) must stably supply high power density
- Liquid cooling (Liquid/CDU) must handle high-density GPU heat in real-time
These elements must be closely integrated in design, and optimizing just one element cannot guarantee overall system performance.
💡 Key Message
AI workloads require moving beyond the traditional layer-by-layer independent design approach of conventional data centers, demanding that computing-network-power-cooling be designed as one integrated system. This demonstrates that a holistic approach is essential when building AI data centers.
📝 Summary
AI data centers fundamentally differ from traditional data centers through the tight integration of computing, networking, power, and cooling systems. GPU-based AI workloads create unprecedented power density and heat generation, requiring liquid cooling and HVDC power systems. Success in AI infrastructure demands holistic design where all components are co-optimized rather than independently engineered.
#AIDataCenter #DataCenterEvolution #GPUInfrastructure #LiquidCooling #AIComputing #LLM #DataCenterDesign #HighPerformanceComputing #AIInfrastructure #HVDC #HolisticDesign #CloudComputing #DataCenterCooling #AIWorkloads #FutureOfDataCenters
With Claude