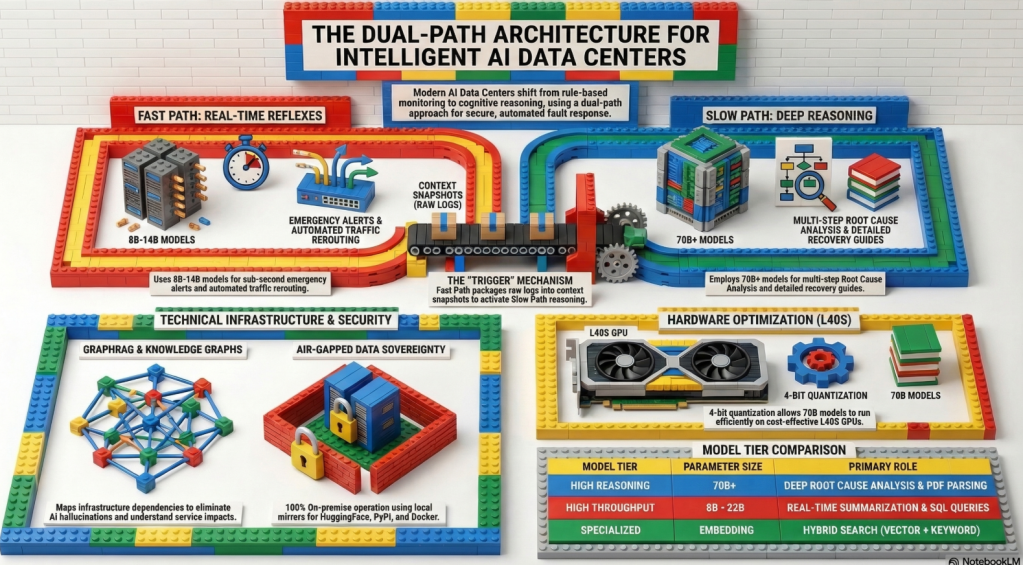
The proposed AI DC Intelligent Incident Response Platform upgrades traditional data center monitoring to an “Autonomous Operations” system within a secure, air-gapped on-premise environment. It features a Dual-Path architecture that utilizes lightweight LLMs for real-time automated alerts (Fast Path) and high-performance LLMs with GraphRAG for deep root-cause analysis (Slow Path). By structuring fragmented manuals and comprehensively mapping infrastructure dependencies, this system significantly reduces recovery time (MTTR) and provides a highly scalable, cost-effective solution for hyper-scale AI data centers
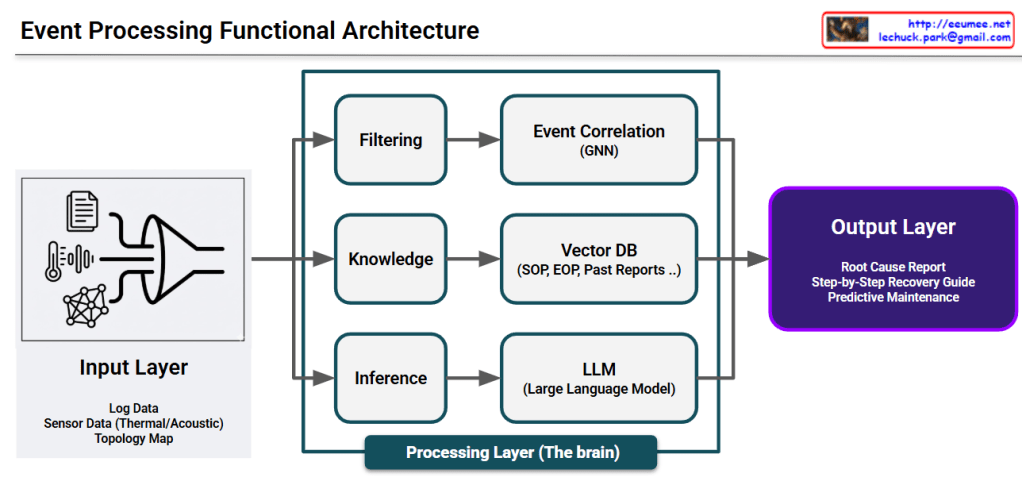
This image illustrates a Data Processing Pipeline (Architecture) where raw data is ingested, analyzed through an AI engine, and converted into actionable business intelligence.
## Image Interpretation: AI-Driven Data Pipeline
### 1. Input Layer (Left: Data Ingestion)
This represents the raw data collected from various sources within the infrastructure:
Log Data (Document Icon): System logs and event records that capture operational history.
Sensor Data (Thermometer & Waveform Icons): Real-time monitoring of physical environments, specifically focusing on Thermal (heat) and Acoustic (noise) patterns.
Topology Map (Network Icon): The structural map of equipment and their interconnections, providing context for how data flows through the system.
### 2. Integration & Processing (Center: The AI Funnel)
The Funnel/Pipe Shape: This symbolizes the process of data fusion and refinement. It represents different data types being standardized and processed through an AI model or analytics engine to filter out noise and identify patterns.
### 3. Output Layer (Right: Actionable Insights)
The final results generated by the analysis, designed to provide immediate value to operators:
Root Cause Report (Document with Magnifying Glass): Identifies the underlying reason for a specific failure or anomaly.
Step-by-Step Recovery Guide (Checklist with Arrows): Provides a sequential, automated, or manual procedure to restore the system to a healthy state.
Predictive Maintenance (Gear with Upward Arrow): Utilizes historical trends to predict potential failures before they occur, optimizing maintenance schedules and reducing downtime.
# Summary
The diagram effectively visualizes the transition from complex raw data to actionable intelligence. It highlights the core value of an AI-driven platform: reducing cognitive load for human operators by providing clear, data-backed directions for maintenance and recovery.
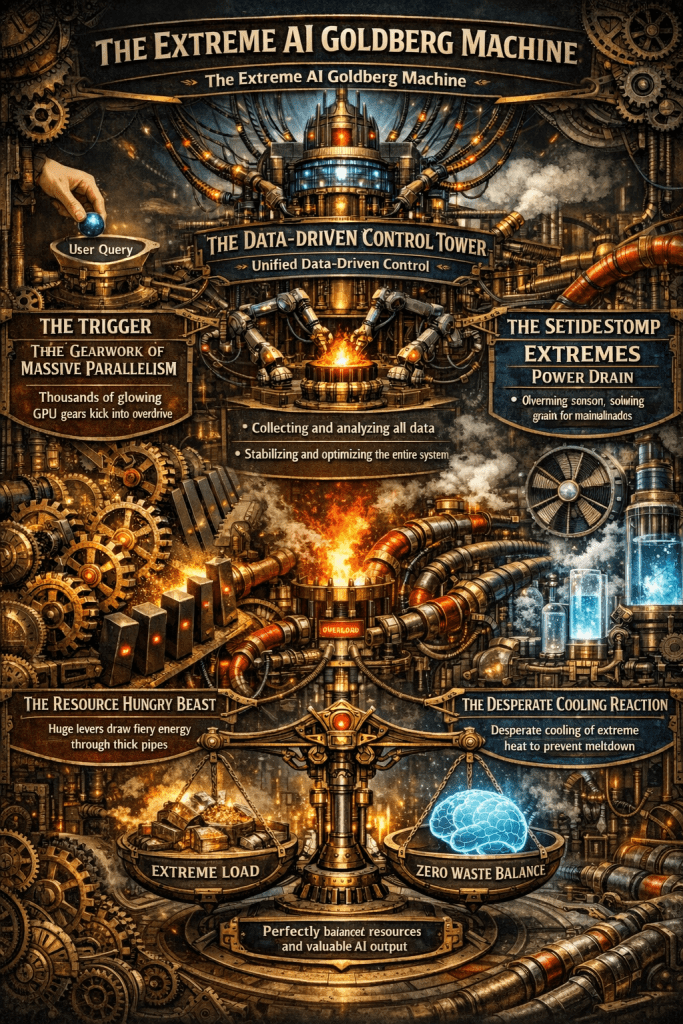
A single AI response triggers a massive chain reaction of compute, power, and cooling. Only unified, data-driven control can stabilize this fragile system and eliminate waste.
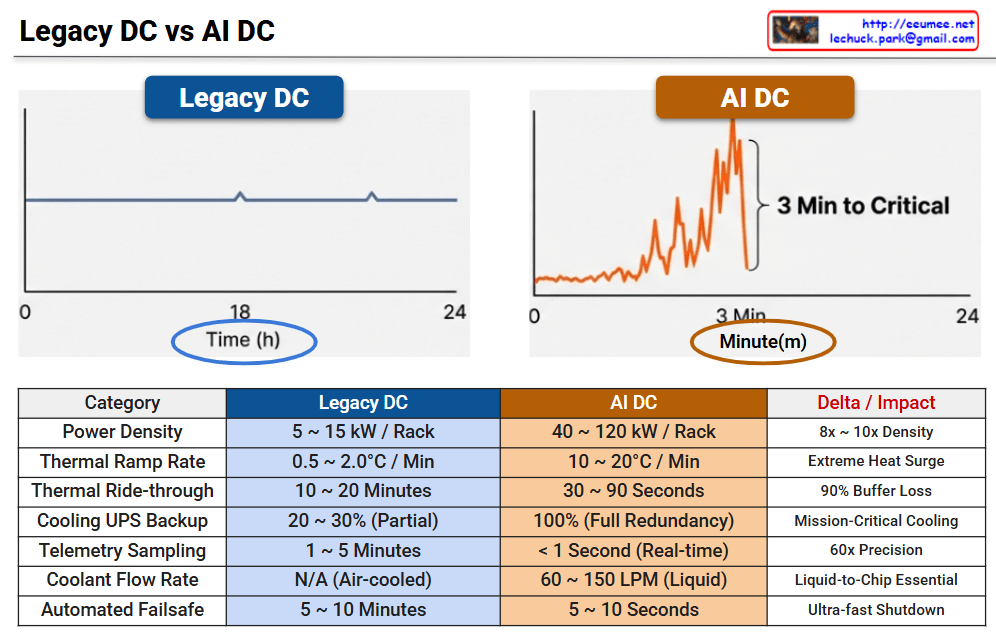
This infographic illustrates the radical shift in operational paradigms between Legacy Data Centers and AI Data Centers, highlighting the transition from “Human-Speed” steady-state management to “Machine-Speed” real-time automation.
📊 Legacy DC vs. AI DC: Operational Metrics Comparison
Category
Legacy DC
AI DC
Delta / Impact
Power Density
5 ~ 15 kW / Rack
40 ~ 120 kW / Rack
8x ~ 10x Density
Thermal Ramp Rate
0.5 ~ 2.0°C / Min
10 ~ 20°C / Min
Extreme Heat Surge
Thermal Ride-through
10 ~ 20 Minutes
30 ~ 90 Seconds
90% Buffer Loss
Cooling UPS Backup
20 ~ 30% (Partial)
100% (Full Redundancy)
Mission-Critical Cooling
Telemetry Sampling
1 ~ 5 Minutes
< 1 Second (Real-time)
60x Precision
Coolant Flow Rate
N/A (Air-cooled)
60 ~ 150 LPM (Liquid)
Liquid-to-Chip Essential
Automated Failsafe
5 ~ 10 Minutes
5 ~ 10 Seconds
Ultra-fast Shutdown
🔍 Graphical Analysis
1. The Volatility Gap
Legacy DC: Shows a stable, predictable power load across a 24-hour cycle. Operations are steady-state and managed on an hourly basis.
AI DC: Features extreme load fluctuations that can reach critical levels within just 3 minutes. This requires monitoring and response to be measured in minutes and seconds rather than hours.
2. The Cooling Imperative
With rack densities reaching 120 kW, air cooling is no longer viable. The shift to Liquid-to-Chip cooling with flow rates up to 150 LPM is mandatory to manage the 10–20°C per minute thermal ramp rates.
3. The End of Manual Intervention
In a Legacy DC, operators have a 20-minute “Golden Hour” to respond to cooling failures. In an AI DC, this buffer collapses to seconds, making sub-second telemetry and automated failsafe protocols the only way to prevent hardware damage.
💡 Summary
Density & Cooling Leap: AI DC demands up to 10x higher power density, necessitating a fundamental shift from traditional air cooling to Direct-to-Chip liquid cooling.
Vanishing Buffer Time: Thermal ride-through time has shrunk from 20 minutes to less than 90 seconds, leaving zero room for manual human intervention during failures.
Real-Time Autonomy: The operational paradigm has shifted to “Machine-Speed” automated control, requiring sub-second telemetry to handle extreme load volatility and ultra-fast failsafe needs.
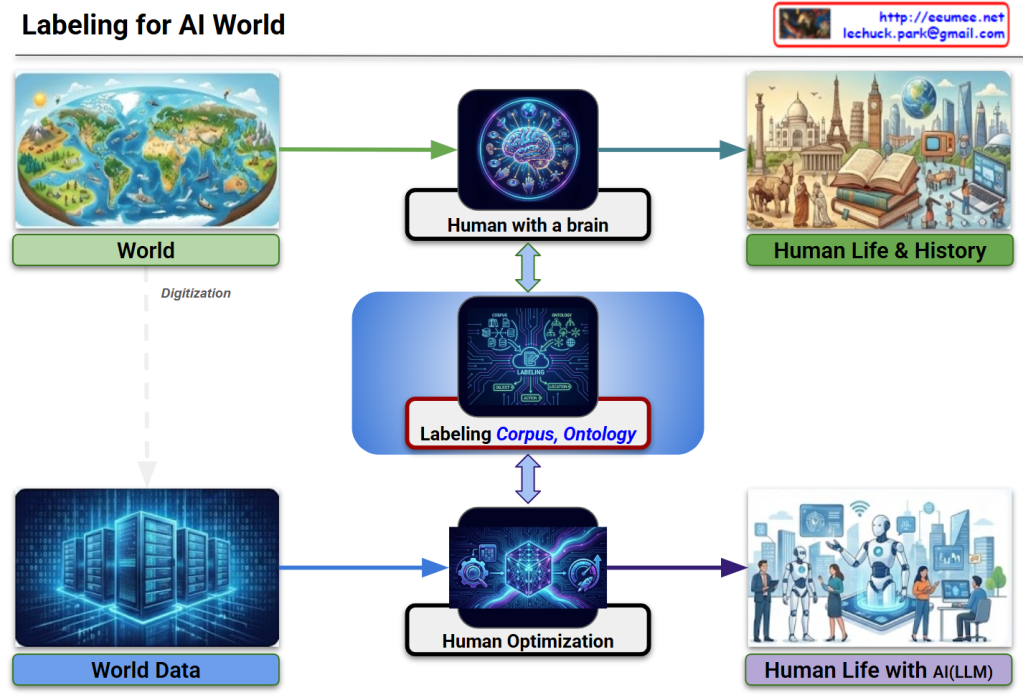
The image illustrates a logical framework titled “Labeling for AI World,” which maps how human cognitive processes are digitized and utilized to train Large Language Models (LLMs). It emphasizes the transition from natural human perception to optimized AI integration.
1. The Natural Cognition Path (Top)
This track represents the traditional human experience:
World to Human with a Brain: Humans sense the physical world through biological organs, which the brain then analyzes and processes into information.
Human Life & History: This cognitive processing results in the collective knowledge, culture, and documented history of humanity.
2. The Digital Optimization Path (Bottom)
This track represents the technical pipeline for AI development:
World Data: Through Digitization, the physical world is converted into raw data stored in environments like AI Data Centers.
Human Optimization: This raw data is refined through processes like RLHF (Reinforcement Learning from Human Feedback) or fine-tuning to align AI behavior with human intent.
Human Life with AI (LLM): The end goal is a lifestyle where humans and LLMs coexist, with the AI acting as a sophisticated partner in daily life.
3. The Central Bridge: Labeling (Corpus & Ontology)
The most critical element of the diagram is the central blue box, which acts as a bridge between human logic and machine processing:
Corpus: Large-scale structured text data necessary for training.
Ontology: The formal representation of categories, properties, and relationships between concepts that define the human “worldview.”
The Link: High-quality Labeling ensures that AI optimization is grounded in human-defined logic (Ontology) and comprehensive language data (Corpus), ensuring both Quality and Optimization.
Summary
The diagram demonstrates that Data Labeling, guided by Corpus and Ontology, is the essential mechanism that translates human cognition into the digital realm. It ensures that LLMs are not just processing raw numbers, but are optimized to understand the world through a human-centric logical framework.
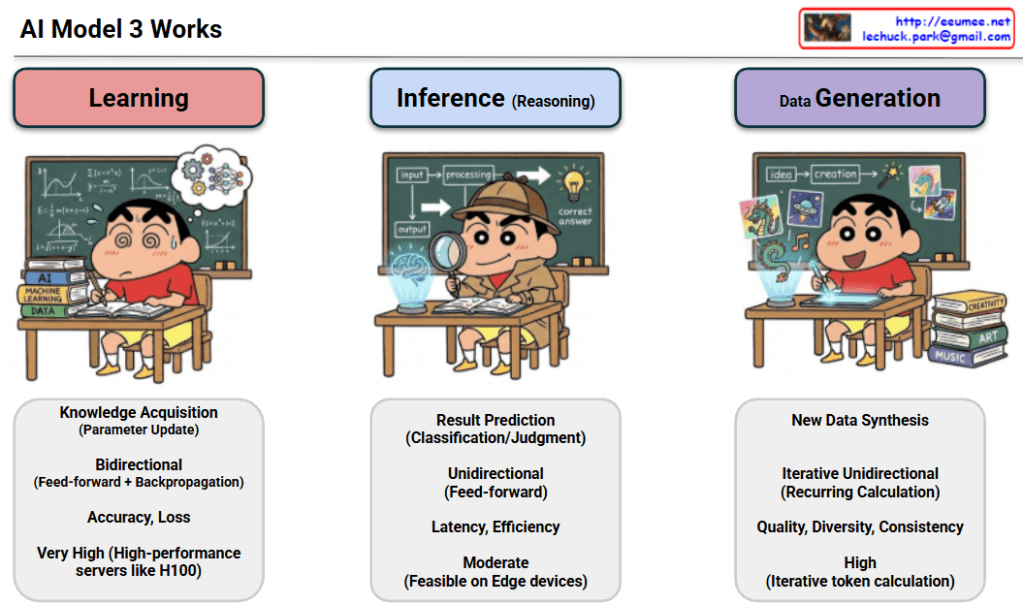
The provided image illustrates the three core stages of how AI models operate: Learning, Inference, and Data Generation.
1. Learning
Goal: Knowledge acquisition and parameter updates. This is the stage where the AI “studies” data to find patterns.
Mechanism:Bidirectional (Feed-forward + Backpropagation). It processes data to get a result and then goes backward to correct errors by adjusting internal weights.
Key Metrics:Accuracy and Loss. The objective is to minimize loss to increase the model’s precision.
Resource Requirement:Very High. It requires high-performance server clusters equipped with powerful GPUs like the NVIDIA H100.
2. Inference (Reasoning)
Goal: Result prediction, classification, and judgment. This is using a pre-trained model to answer specific questions (e.g., “What is in this picture?”).
Mechanism:Unidirectional (Feed-forward). Data simply flows forward through the model to produce an output.
Key Metrics:Latency and Efficiency. The focus is on how quickly and cheaply the model can provide an answer.
Resource Requirement:Moderate. It is efficient enough to be feasible on “Edge devices” like smartphones or local PCs.
3. Data Generation
Goal: New data synthesis. This involves creating entirely new content like text, images, or music (e.g., Generative AI like ChatGPT).
Mechanism:Iterative Unidirectional (Recurring Calculation). It generates results piece by piece (token by token) in a repetitive process.
Key Metrics:Quality, Diversity, and Consistency. The focus is on how natural and varied the generated output is.
Resource Requirement:High. Because it involves iterative calculations for every single token, it requires more power than simple inference.
Summary
AI processes consist of Learning (studying data), Inference (applying knowledge), and Data Generation (creating new content).
Learning requires massive server power for bidirectional updates, while Inference is optimized for speed and can run on everyday devices.
Data Generation synthesizes new information through repetitive, iterative calculations, requiring high resources to maintain quality.
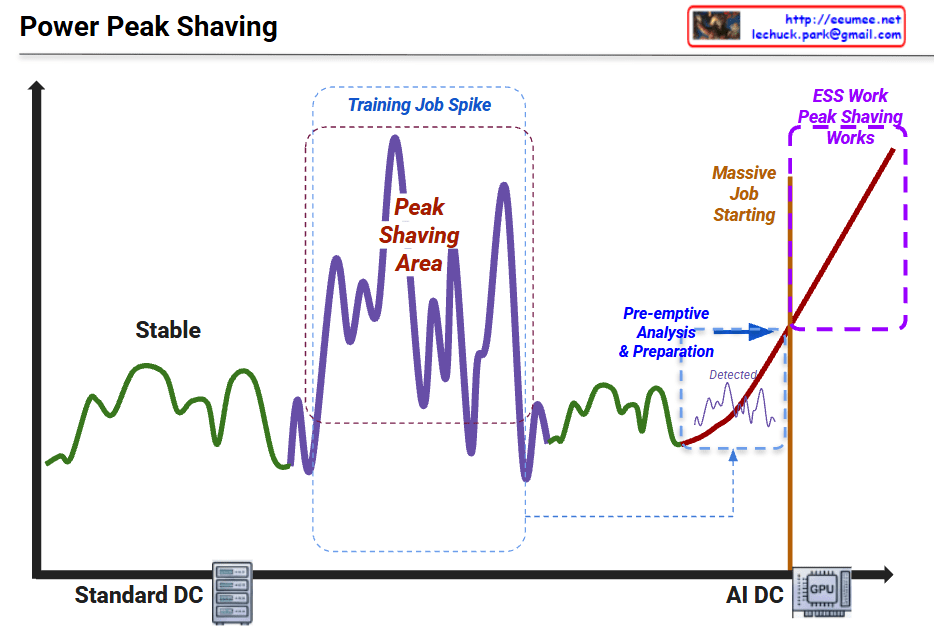
Graph Interpretation: Power Peak Shaving in AI Data Centers
This graph illustrates the shift in power consumption patterns from traditional data centers to AI-driven data centers and the necessity of “Peak Shaving” strategies.
1. Standard DC (Green Line – Left)
Characteristics: Shows “Stable” power consumption.
Interpretation: Traditional server workloads are relatively predictable with low volatility. The power demand stays within a consistent range.
Interpretation: During AI model training, power demand becomes highly volatile. The spikes (peaks) and valleys represent the intensive GPU cycles required during training phases.
3. AI DC & Massive Job Starting (Red Line – Right)
Characteristics: A sharp, vertical-like surge in power usage.
Interpretation: As massive AI jobs (LLM training, etc.) start, the power load skyrockets. The graph shows a “Pre-emptive Analysis & Preparation” phase where the system detects the surge before it hits the maximum threshold.
4. ESS Work & Peak Shaving (Purple Dotted Box – Top Right)
The Strategy: To handle the “Massive Job Starting,” the system utilizes ESS (Energy Storage Systems).
Action: Instead of drawing all power from the main grid (which could cause instability or high costs), the ESS discharges stored energy to “shave” the peak, smoothing out the demand and ensuring the AI DC operates safely.
Summary
Volatility Shift: AI workloads (GPU-intensive) create much more extreme and unpredictable power spikes compared to standard data center operations.
Proactive Management: Modern AI Data Centers require pre-emptive detection and analysis to prepare for sudden surges in energy demand.
ESS Integration: Energy Storage Systems (ESS) are critical for “Peak Shaving,” providing the necessary power buffer to maintain grid stability and cost efficiency.