Operation

With a Claude’s Help
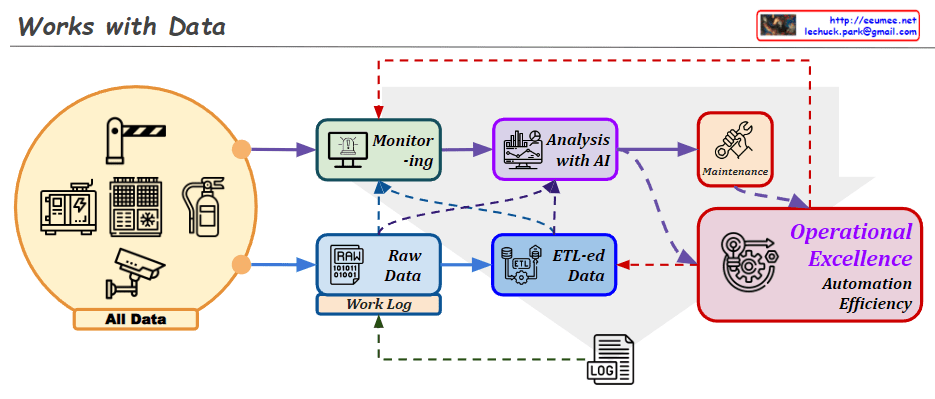
  1. Normal State:
  • Represented by a gear icon with a green checkmark
  • Indicates system operating under normal conditions
  • Initial state of the monitoring process
  1. Anomaly Detection:
  • Shown with a magnifying glass and graph patterns
  • The graph patterns are more clearly visualized than before
  • Represents the phase where deviations from normal patterns are detected
  1. Abnormal State:
  • Depicted by a human figure with warning indicators
  • Represents confirmed abnormal conditions requiring intervention
  • Links directly to action steps
  1. Analysis and Response Process:
  • Comparison with normal: Shown through A/B document comparison icons
  • Analysis: Data examination phase
  • predictive Action: Now written in lowercase, indicating predicted response measures
  • Recovery Action: Implementation of actual recovery measures
  1. Learning Feedback:
  • Shows how lessons from recovery actions are fed back into the system
  • Creates a continuous improvement loop
  • Connects recovery actions back to normal operations

The workflow continues to effectively illustrate the complete operational cycle, from monitoring and detection through analysis, response, and continuous learning. It demonstrates a systematic approach to handling operational anomalies and maintaining system stability.

DC OP Platform

From Claude with some prompting
This image depicts a diagram of the “DC op Platform” (Data Center Operations Platform). The main components are as follows:

  1. On the left, there’s “DC Op Env.” (Data Center Operations Environment), which consists of three main parts:
    • DCIM (Data Center Infrastructure Management)
    • Auto Control
    • Facility These three elements undergo a “Standardization” process.
  2. In the center, there are two “Standardization” server icons, representing the standardization process of the platform.
  3. On the right, there’s the “Data Center Op. Platform”, which comprises three main components:
    • Service Development
    • Integrated operations
    • Server Room Digital Twin
  4. Arrows show how the standardized elements connect to these three main components.

This diagram visually illustrates how the data center operations environment evolves through a standardization process into an integrated data center operations platform.

AI DC Key

From Claude with some prompting
This image titled “AI DC Key” illustrates the key components of an AI data center. Here’s an interpretation of the diagram:

  1. On the left, there’s an icon representing “Massive Data”.
  2. The center showcases four core elements of AI:
    • “Super Power”
    • “Super Computing” (utilizing GPU)
    • “Super Cooling”
    • “Optimizing Operation”
  3. Below each core element, key considerations are listed:
    • Super Power: “Nature & Consistent”
    • Super Computing: “Super Parallel”
    • Super Cooling: “Liquid Cooling”
    • Optimizing Operation: “Data driven Auto & AI”
  4. On the right, an icon represents “Analyzed Data”.
  5. The overall flow illustrates the process of massive data being input, processed through the AI core elements, and resulting in analyzed data.

This diagram visualizes the essential components of a modern AI data center and their key considerations. It demonstrates how high-performance computing, efficient power management, advanced cooling technology, and optimized operations effectively process and analyze large-scale data, emphasizing the critical technologies or approaches for each element.

Standardized Platform with the AI

From Claude with some prompting
This image illustrates a “Standardized Platform with the AI”. Here’s a breakdown of the key components and processes:

  1. Left side: Various devices or systems (generator, HVAC system, fire detector, etc.) are shown. Each device is connected to an alarm system and a monitoring screen.
  2. Center: “Metric Data” from these devices is sent to a central gear-shaped icon, representing a data processing system.
  3. Upper right: The processed data is displayed on a dashboard or analytics screen.
  4. Lower right: There’s a section labeled “Operation Process”, indicating management or optimization of operational processes.
  5. Far right: Boxes representing the system’s components:
    • “Standardization”
    • “Platform”
    • “AI”
  6. Bottom: “Digitalization strategy” serves as the foundation for the entire system.

This diagram visualizes a digital transformation strategy that collects data from various systems and devices, processes it using AI on a standardized platform, and uses this to optimize and manage operations.

The flow shows how raw data from different sources is standardized, processed, and utilized to create actionable insights and improve operational efficiency, all underpinned by a comprehensive digitalization strategy.

Operation with AI

From Claude with some prompting
This diagram illustrates an integrated approach to modern operational management. The system is divided into three main components: data generation, data processing, and AI application.

The Operation & Biz section shows two primary data sources. First, there’s metric data automatically generated by machines such as servers and network equipment. Second, there’s textual data created by human operators and customer service representatives, primarily through web portals.

These collected data streams then move to the central Data Processing stage. Here, metric data is processed through CPUs and converted into time series data, while textual data is structured via web business services.

Finally, in the AI play stage, different AI models are applied based on data types. For time series data, models like RNN, LSTM, and Auto Encoder are used for predictive analytics. Textual data is processed through a Large Language Model (LLM) to extract insights.

This integrated system effectively utilizes data from various sources to improve operational efficiency, support data-driven decision-making, and enable advanced analysis and prediction through AI. Ultimately, it facilitates easy and effective management even in complex operational environments.

The image emphasizes how different types of data – machine-generated metrics and human-generated text – are processed and analyzed using appropriate AI techniques, all from the perspective of operational management.

AI Operation with numbers

From DALL-E with some prompting
The image illustrates an AI-based operational framework using numerical data for real-time operation, monitoring, and predictive maintenance. Data, such as temperature readings, is collected in digital form (“Get Digitals”). When operating within normal parameters (18°C to 27°C), the system maintains a “Normal Case” status. Any changes in the data trigger alerts and cautions. The AI model learns from numerical data to differentiate between normal and abnormal patterns. Upon detecting an anomaly, the system initiates a recovery process as part of predictive maintenance, aiming to address issues before they escalate.

Works with data

From DALL-E with some prompting
The image describes a data workflow process that involves various stages of data handling and utilization for operational excellence. “All Data” from diverse sources feeds into a monitoring system, which then processes raw data, including work logs. This raw data undergoes ETL (Extract, Transform, Load) procedures to become structured “ETL-ed Data.” Following ETL, the data is analyzed with AI to extract insights and inform decisions, which can lead to actions such as maintenance. The ultimate goal of this process is to achieve operational excellence, automation, and efficiency.