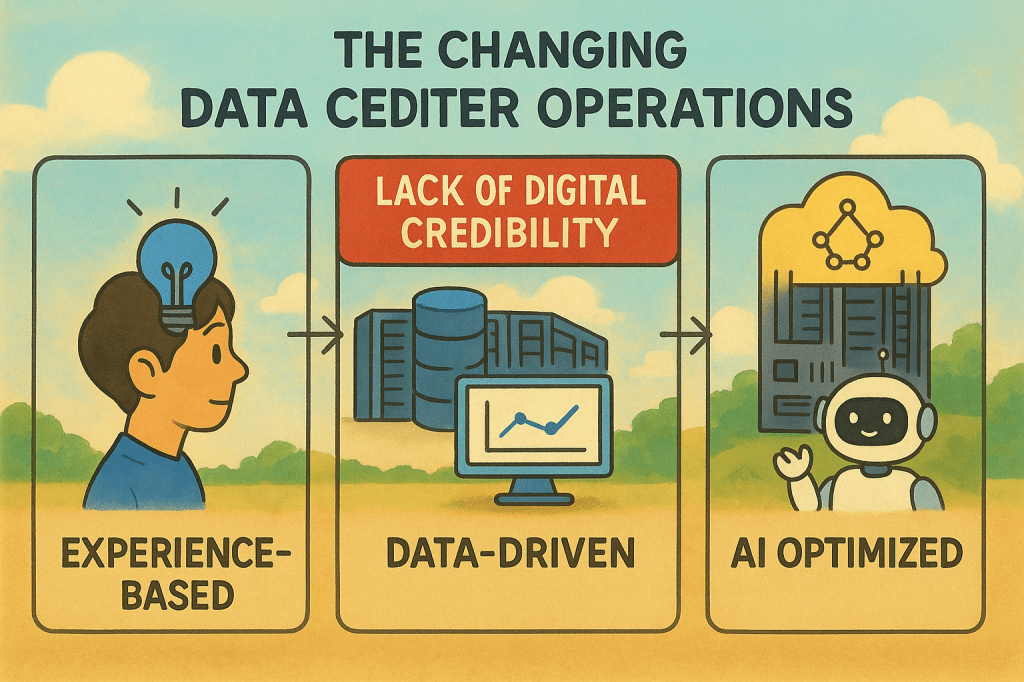
Data center operations are shifting from experience-driven practices toward data-driven and AI-optimized systems. However, a fundamental challenge persists: the lack of digital credibility.
Insufficient data quality: Incomplete monitoring data and unreliable hardware reduce trust.
Limited digital expertise of integrators: Many providers focus on traditional design/operations, lacking strong datafication and automation capabilities.
Absence of verification frameworks: No standardized process to validate or certify collected data and analytical outputs.
These gaps are amplified by the growing scale and complexity of data centers and the expansion of GPU adoption, making them urgent issues that must be addressed for the next phase of digital operations.
This diagram demonstrates the evolution from Reactive Operations to Proactive Operations, where:
Traditional Approach: Wait for problems → React
Modern Approach: Detect changes → Predict → Respond proactively
The framework recognizes change as the trigger for all operational activities, embodying the contemporary IT operations paradigm where:
Operations are event-driven rather than schedule-driven
Intelligence (AI/Analytics) transforms raw change data into actionable insights
Automation ensures appropriate responses to different types of changes
This represents a shift toward Change-Driven Operations Management, where the operational workload directly correlates with the rate and nature of system changes, enabling more efficient resource utilization and better service reliability.
This diagram illustrates the architecture of an LLM Operations (LLMOps) system, demonstrating how Large Language Models are deployed and operated in industrial settings.
Key Components and Data Flow
1. Data Input Sources (3 Categories)
Facility: Digitized sensor data that gets detected and generates alert/event logs
Manual: Equipment manuals and technical documentation
Experience: Operational manuals including SOP/MOP/EOP (Standard/Maintenance/Emergency Operating Procedures)
2. Central Processing System
RAG (Retrieval-Augmented Generation): A central hub that integrates and processes all incoming data
Facility data is visualized through metrics and charts for monitoring purposes
3. LLM Operations
The central LLM synthesizes all information to provide intelligent operational support
Interactive interface enables user communication and queries
4. Final Output and Control
Dashboard for data visualization and monitoring
AI chatbot for real-time operational assistance
Operator Control: The bottom section shows checkmark (✓) and X-mark (✗) buttons along with an operator icon, indicating that final decision-making authority remains with human operators
System Characteristics
This system represents a smart factory solution that integrates AI into traditional industrial operations, providing comprehensive management from real-time data monitoring to operational manual utilization.
The key principle is that while AI provides comprehensive analysis and recommendations, the final operational decisions and approvals still rest with human operators. This is clearly represented through the operator icon and approval/rejection buttons at the bottom of the diagram.
This demonstrates a realistic and desirable AI operational model that emphasizes safety, accountability, and the importance of human judgment in unpredictable situations.
This image is an architecture diagram titled “ALL to LLM” that illustrates the digital transformation of industrial facilities and AI-based operational management systems.
Left Section (Industrial Equipment):
Cooling tower (cooling system)
Chiller (refrigeration/cooling equipment)
Power transformer (electrical power conversion equipment)
UPS (Uninterruptible Power Supply)
Central Processing:
Monitor with gears: Equipment data collection and preprocessing system
Dashboard interface: “All to Bit” analog-to-digital conversion interface
Bottom gears and human icon: Manual/automated operational system management
Right Section (AI-based Operations):
Purple area with binary code (0s and 1s): All facility data converted to digital bit data
Robot icons: LLM-based automated operational systems
Document/analysis icons: AI analysis results and operational reports
Overall, this diagram represents the transformation from traditional manual or semi-automated industrial facility operations to a fully digitized system where all operational data is converted to bit-level information and managed through LLM-powered intelligent facility management and predictive maintenance in an integrated operational system.
Power Consumption Rise: 0.42kW → 1.26kW (3x increase)
Temperature Delta Rise: 7°C → 17°C (increased heat generation)
Cooling System Response:
Water flow rate: 200 LPM → 600 LPM (3x increase)
Fan speed: 600 RPM → 1200 RPM (2x increase)
Operational Prediction Implications
Operating Costs: Approximately 3x increase from baseline expected
Spare Capacity: 40% cooling system capacity remaining
Expansion Capability: Current setup can accommodate additional 67% GPU load
This AI data center monitoring dashboard illustrates the cascading resource changes when GPU workload increases from 30% to 90%, triggering proportional increases in power consumption (3x), cooling flow rate (3x), and fan speed (2x). The system demonstrates predictable operational scaling patterns, with current cooling capacity showing 40% remaining headroom for additional GPU load expansion. Note: All values are estimated figures for demonstration purposes.
Note: All numerical values are estimated figures for demonstration purposes and do not represent actual measured data.
This image illustrates “Basic Power Operations,” showing the path and processes of electricity flowing from source to end-use.
The upper diagram includes the following key components from left to right:
Power Source/Intake – High voltage for efficient delivery with high warning
Transformer – Performs voltage step-down
Generator and Fuel Tank – Backup Power
Transformer #2 – Additional voltage step-down
UPS/Battery – 2nd Backup Power
PDU/TOB – Supplies power to the final servers
The diagram displays two backup power systems:
Backup power (Full outage) – Functions during complete power failures with backup time provided by Oil Tank with Generators
Backup Power (Partial outage) – Operates during partial outages with backup time provided by the Battery with UPSs
The simplified diagram at the bottom summarizes the complex power system into these fundamental elements:
Source – Origin point of power
Step-down – Voltage conversion
Backup – Emergency power supply
Use – Final power consumption
Throughout all stages of this process, two critical functions occur continuously:
Transmit – The ongoing process of transferring power that happens between and during all steps
Switching/Block – Control points distributed throughout the system that direct, regulate, or block power flow as needed
This demonstrates that seemingly complex power systems can be distilled into these essential concepts, with transmission and switching/blocking functioning as integral operations that connect and control all stages of the power delivery process.
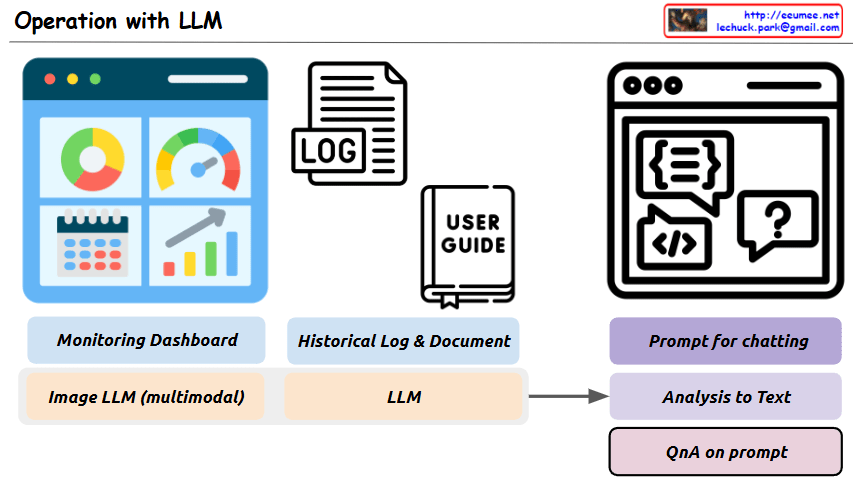
This image is a diagram titled “Operation with LLM,” showing a system architecture that integrates Large Language Models (LLMs) with existing operational technologies.
The main purpose of this system is to more efficiently analyze and solve various operational data and situations using LLMs.
Key components and functions:
Top Left: “Monitoring Dashboard” – Provides an environment where LLMs can interpret image data collected from monitoring screens.
Top Center: “Historical Log & Document” – LLMs analyze system log files and organize related processes from user manuals.
Top Right: “Prompt for chatting” – An interface for interacting with LLMs through appropriate prompts.
Bottom Left: “Image LLM (multimodal)” – Represents multimodal LLM functionality for interpreting images from monitoring screens.
Bottom Center: “LLM” – The core language model component that processes text-based logs and documents.
Bottom Right:
“Analysis to Text” – LLMs analyze various input sources and convert them to text
“QnA on prompt” – Users can ask questions about problem situations, and LLMs provide answers
This system aims to build an integrated operational environment where problems occurring in operational settings can be easily analyzed through LLM prompting and efficiently solved through a question-answer format.