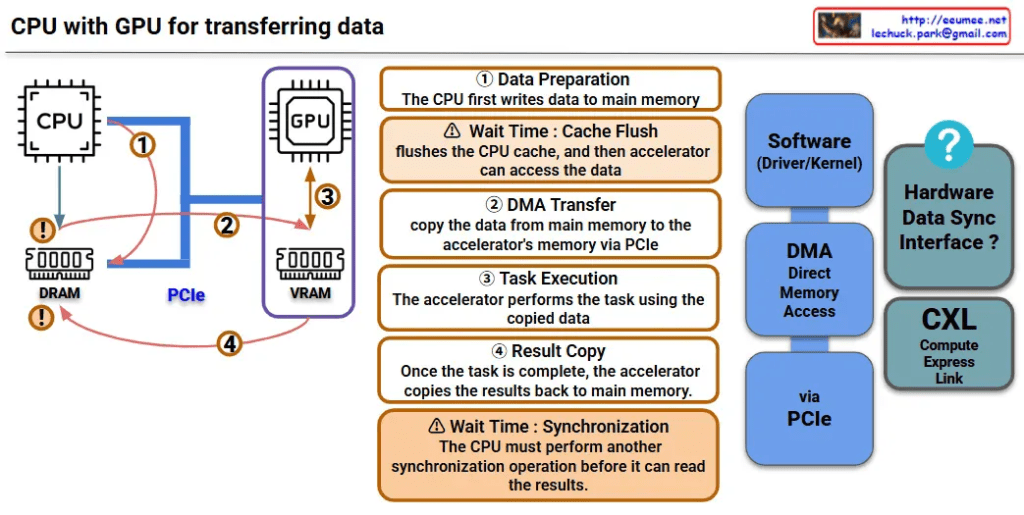
PIM processing-in-memory

This image illustrates the evolution of computing architectures, comparing three major computing paradigms:

1. General Computing (Von Neumann Architecture)

  • Traditional CPU-memory structure
  • CPU and memory are separated, processing complex instructions
  • Data and instructions move between memory and CPU

2. GPU Computing

  • Collaborative structure between CPU and GPU
  • GPU performs simple mathematical operations with massive parallelism
  • Provides high throughput
  • Uses new types of memory specialized for AI computing

3. PIM (Processing-in-Memory)

The core focus of the image, PIM features the following characteristics:

Core Concept:

  • “Simple Computing” approach that performs operations directly within new types of memory
  • Integrated structure of memory and processor

Key Advantages:

  • Data Movement Minimization: Reduces in-memory copy/reordering operations
  • Parallel Data Processing: Parallel processing of matrix/vector operations
  • Repetitive Simple Operations: Optimized for add/multiply/compare operations
  • “Simple Computing”: Efficient operations without complex control logic

PIM is gaining attention as a next-generation computing paradigm that can significantly improve energy efficiency and performance compared to existing architectures, particularly for tasks involving massive repetitive simple operations such as AI/machine learning and big data analytics.

With Claude

Components for AI Work

This diagram visualizes the core concept that all components must be organically connected and work together to successfully operate AI workloads.

Importance of Organic Interconnections

Continuity of Data Flow

  • The data pipeline from Big Data → AI Model → AI Workload must operate seamlessly
  • Bottlenecks at any stage directly impact overall system performance

Cooperative Computing Resource Operations

  • GPU/CPU computational power must be balanced with HBM memory bandwidth
  • SSD I/O performance must harmonize with memory-processor data transfer speeds
  • Performance degradation in one component limits the efficiency of the entire system

Integrated Software Control Management

  • Load balancing, integration, and synchronization coordinate optimal hardware resource utilization
  • Real-time optimization of workload distribution and resource allocation

Infrastructure-based Stability Assurance

  • Stable power supply ensures continuous operation of all computing resources
  • Cooling systems prevent performance degradation through thermal management of high-performance hardware
  • Facility control maintains consistency of the overall operating environment

Key Insight

In AI systems, the weakest link determines overall performance. For example, no matter how powerful the GPU, if memory bandwidth is insufficient or cooling is inadequate, the entire system cannot achieve its full potential. Therefore, balanced design and integrated management of all components is crucial for AI workload success.

The diagram emphasizes that AI infrastructure is not just about having powerful individual components, but about creating a holistically optimized ecosystem where every element supports and enhances the others.

With Claude

AI Core Internals (1+4)

This image is a diagram titled “AI Core Internals (1+4)” that illustrates the core components of an AI system and their interconnected relationships.

The diagram contains 5 main components:

  1. Data – Located in the top left, represented by database and document icons.
  2. Hardware Infra – Positioned in the top center, depicted with a CPU/chipset icon with radiating connections.
  3. Foundation(AI) Model – Located in the top right, shown as an AI network node with multiple connection points.
  4. Energy Infra – Positioned at the bottom, represented by wind turbine and solar panel icons.
  5. User Group – On the far right, depicted as a collection of diverse people icons in various colors.

The arrows show the flow and connections between components:

  • From Data to Hardware Infrastructure
  • From Hardware Infrastructure to the AI Model
  • From the AI Model to end users
  • From Energy Infrastructure to Hardware Infrastructure (power supply)

This diagram visually explains how modern AI systems integrate data, computing hardware, AI models, and energy infrastructure to deliver services to end users. It effectively demonstrates the interdependent ecosystem required for AI operations, highlighting both the technical components (data, hardware, models) and the supporting infrastructure (energy) needed to serve diverse user communities.

With Claude

Server Room Workload

This diagram illustrates a server room thermal management system workflow.

System Architecture

Server Internal Components:

  • AI Workload, GPU Workload, and Power Workload are connected to the CPU, generating heat

Temperature Monitoring Points:

  • Supply Temp: Cold air supplied from the cooling system
  • CoolZone Temp: Temperature in the cooling zone
  • Inlet Temp: Server inlet temperature
  • Outlet Temp: Server outlet temperature
  • Hot Zone Temp: Temperature in the heat exhaust zone
  • Return Temp : Hot air return to the cooling system

Cooling System:

  • The Cooling Workload on the left manages overall cooling
  • Closed-loop cooling system that circulates back via Return Temp

Temperature Delta Monitoring

The bottom flowchart shows how each workload affects temperature changes (ΔT):

  • Delta temperature sensors (Δ1, Δ2, Δ3) measure temperature differences across each section
  • This data enables analysis of each workload’s thermal impact and optimization of cooling efficiency

This system appears to be a data center thermal management solution designed to effectively handle high heat loads from AI and GPU-intensive workloads. The comprehensive temperature monitoring allows for precise control and optimization of the cooling infrastructure based on real-time workload demands.

With Claude

Dynamic Voltage and Frequency Scaling (in GPU)

This image illustrates the DVFS (Dynamic Voltage and Frequency Scaling) system workflow, which is a power management technique that dynamically adjusts CPU/GPU voltage and frequency to optimize power consumption.

Key Components and Operation Flow

1. Main Process Flow (Top Row)

  • Workload InitWorkload AnalysisDVFS Policy DecisionClock Frequency AdjustmentVoltage AdjustmentWorkload ExecutionWorkload Finish

2. Core System Components

Power State Management:

  • Basic power states: P0~P12 (P0 = highest performance, P12 = lowest power)
  • Real-time monitoring through PMU (Power Management Unit)

Analysis & Decision Phase:

  • Applies dynamic power consumption formula using algorithms
  • Considers thermal limits in analysis
  • Selects new power state (High: P0-P2, Low: P8-P10)
  • P-State changes occur within 10μs~1ms

Frequency Adjustment (PLL – Phase-Locked Loop):

  • Adjusts GPU core and memory clock frequencies
  • Typical range: 1,410MHz~1,200MHz (memory), 1,000MHz~600MHz (core)
  • Adjustment time: 10-100 microseconds

Voltage Adjustment (VRM – Voltage Regulator Module):

  • Adjusts voltage supplied to GPU core and memory
  • Typical range: 1.1V (P0) to 0.8V (P8)
  • VRM stabilizes voltage within tens of microseconds

3. Real-time Feedback Loop

The system operates a continuous feedback loop that readjusts P-states in real-time based on workload changes, maintaining optimal balance between performance and power efficiency.

4. Execution Phase

The GPU executes workloads at new frequency and voltage settings, with asynchronous adjustments based on frequency and voltage changes. After completion, the system transitions to low-power states (e.g., P10, P12) to conserve energy.


Summary: Key Benefits of DVFS

DVFS technology is for AI data centers as it optimizes GPU efficiency management to achieve maximum overall power efficiency. By intelligently scaling thousands of GPUs based on AI workload demands, DVFS can reduce total data center power consumption by 30-50% while maintaining peak AI performance during training and inference operations, making it essential for sustainable and cost-effective AI infrastructure at scale.

With Claude

Computing Changes with Power/Cooling

This chart compares power consumption and cooling requirements for server-grade computing hardware.

CPU Servers (Intel Xeon, AMD EPYC)

  • 1U-4U Rack: 0.2-1.2kW power consumption
  • 208V power supply
  • Standard air cooling (CRAC, server fans) sufficient
  • PUE: 1.4-1.6 (Power Usage Effectiveness)

GPU Servers (DGX Series)

Power consumption and cooling complexity increase dramatically:

Low-Power Models (DGX-1, DGX-2)

  • 3.5-10kW power consumption
  • Tesla V100 GPUs
  • High-performance air cooling required

Medium-Power Models (DGX A100, H100)

  • 6.5-10.2kW power consumption
  • 400V high voltage required
  • Liquid cooling recommended or essential

Highest-Performance Models (DGX B200, GB200)

  • 14.3-120kW extreme power consumption
  • Blackwell architecture GPUs
  • Full liquid cooling essential
  • PUE 1.1-1.2 with improved cooling efficiency

Key Trends Summary

The evolution from CPU to GPU computing represents a fundamental shift in data center infrastructure requirements. Power consumption scales dramatically from kilowatts to tens of kilowatts, driving the transition from traditional air cooling to sophisticated liquid cooling systems. Higher-performance systems paradoxically achieve better power efficiency through advanced cooling technologies, while requiring substantial infrastructure upgrades including high-voltage power delivery and comprehensive thermal management solutions.

※ Disclaimer: All figures presented in this chart are approximate reference values and may vary significantly depending on actual environmental conditions, workloads, configurations, ambient temperature, and other operational factors.

WIth Claude

GPU Server Room : Changes

Image Overview

This dashboard displays the cascading resource changes that occur when GPU workload increases in an AI data center server room monitoring system.

Key Change Sequence (Estimated Values)

  1. GPU Load Increase: 30% → 90% (AI computation tasks initiated)
  2. Power Consumption Rise: 0.42kW → 1.26kW (3x increase)
  3. Temperature Delta Rise: 7°C → 17°C (increased heat generation)
  4. Cooling System Response:
    • Water flow rate: 200 LPM → 600 LPM (3x increase)
    • Fan speed: 600 RPM → 1200 RPM (2x increase)

Operational Prediction Implications

  • Operating Costs: Approximately 3x increase from baseline expected
  • Spare Capacity: 40% cooling system capacity remaining
  • Expansion Capability: Current setup can accommodate additional 67% GPU load

This AI data center monitoring dashboard illustrates the cascading resource changes when GPU workload increases from 30% to 90%, triggering proportional increases in power consumption (3x), cooling flow rate (3x), and fan speed (2x). The system demonstrates predictable operational scaling patterns, with current cooling capacity showing 40% remaining headroom for additional GPU load expansion. Note: All values are estimated figures for demonstration purposes.

Note: All numerical values are estimated figures for demonstration purposes and do not represent actual measured data.

With Claude