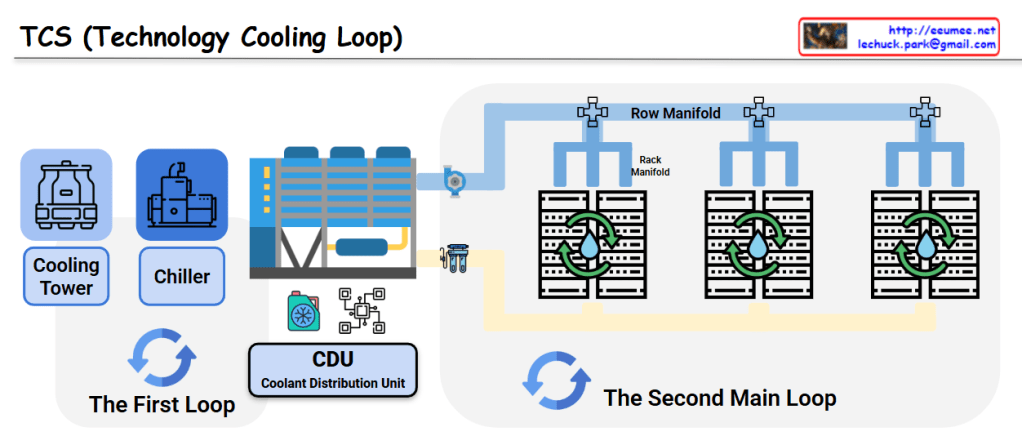
This image shows a diagram of the TCS (Technology Cooling Loop) system structure.
System Components
The First Loop:
Cooling Tower: Dissipates heat to the atmosphere
Chiller: Generates chilled water
CDU (Coolant Distribution Unit): Distributes coolant throughout the system
The Second Main Loop:
Row Manifold: Distributes cooling water to each server rack row
Rack Manifold: Individual rack-level cooling water distribution system
Server Racks: IT equipment racks that require cooling
System Operation
Primary Loop: The cooling tower releases heat to the outside air, while the chiller produces chilled water that is supplied to the CDU
Secondary Loop: Coolant distributed from the CDU flows through the Row Manifold to each server rack’s Rack Manifold, cooling the servers
Circulation System: The heated coolant returns to the CDU where it is re-cooled through the primary loop
This is an efficient cooling system used in data centers and large-scale IT facilities. It systematically removes heat generated by server equipment to ensure stable operations through a two-loop architecture that separates the heat rejection process from the precision cooling delivery to IT equipment.
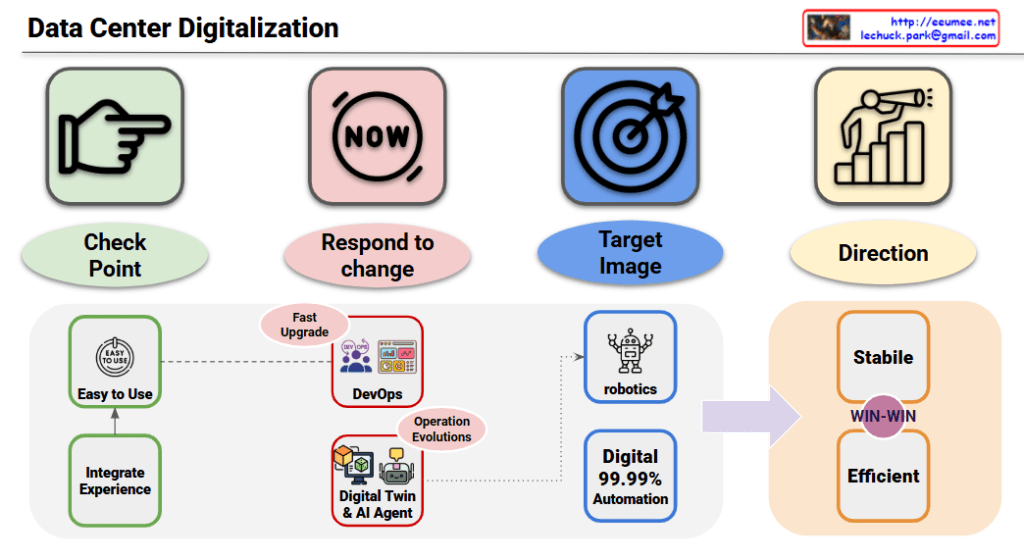
This image presents a roadmap for “Data Center Digitalization” showing the evolutionary process. Based on your explanation, here’s a more accurate interpretation:
Top 4 Core Concepts (Purpose for All Stages)
Check Point: Current state inspection and verification point for each stage
Respond to change: Rapid response system to quick changes
Target Image: Final target state to be achieved
Direction: Overall strategic direction setting
Digital Transformation Evolution Stages
Stage 1: Experience-Based Digital Environment Foundation
Easy to Use: Creating user-friendly digital environments through experience
Integrate Experience: Integrating existing data center operational experience and know-how into the digital environment
Purpose: Utilizing existing operational experience as checkpoints to establish a foundation for responding to changes
This diagram presents a strategic roadmap where data centers systematically integrate existing operational experience and know-how into digital environments, evolving step by step while reflecting the top 4 core concepts as purposes for each stage, ultimately achieving both stability and efficiency simultaneously.
→ Operational Response: DevOps + Big Data/AI Prediction
Development-Operations integration through DevOps
Intelligent operations through big data analytics and AI prediction
2. New DC (New Data Center)
Environmental Change: New/Edge and various types of data centers
Proliferation of new edge data centers
Distributed infrastructure environment
→ Operational Response: Integrated Operations
Multi-center integrated management
Standardized operational processes
Role-based operational framework
3. AI DC (AI Data Center)
Environmental Change: GPU Large-scale Computing/Massive Power Requirements
GPU-intensive high-performance computing
Enormous power consumption
→ Operational Response: Digital Twin – Real-time Data View
Digital replication of actual configurations
High-quality data-based monitoring
Real-time predictive analytics including temperature prediction
This diagram systematically demonstrates that as data center environments undergo physical changes, operational approaches must also become more intelligent and integrated in response.
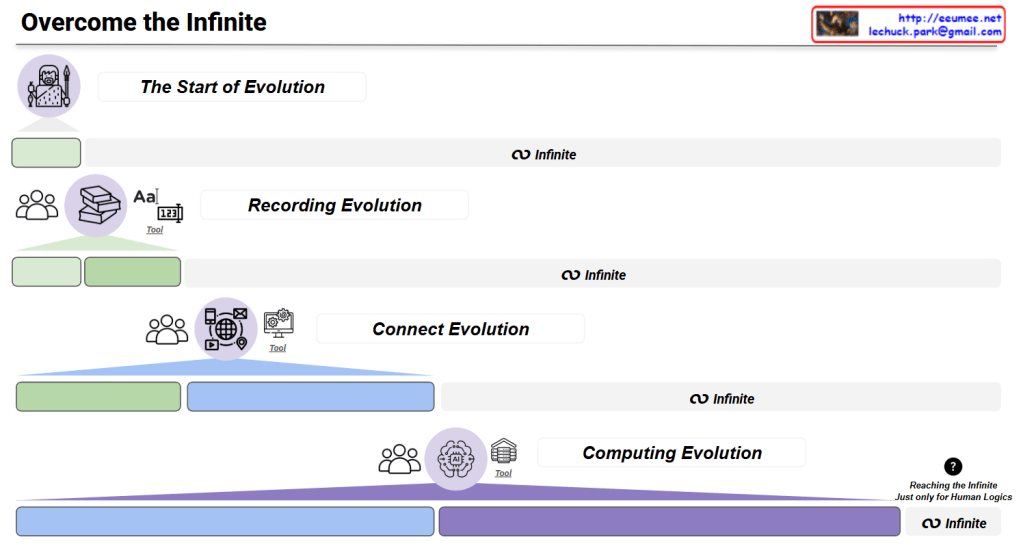
This image presents a philosophical game interface titled “Overcome the Infinite” that chronicles the evolutionary journey of human civilization through four revolutionary stages of innovation.
Game Structure
Stage 1: The Start of Evolution
Icon: Primitive human figure
Description: The beginning of human civilization and consciousness
Stage 2: Recording Evolution
Icon: Books and writing materials
Innovation: The revolution of knowledge storage through numbers, letters, and books
Significance: Transition from oral tradition to written documentation, enabling permanent knowledge preservation
Stage 3: Connect Evolution
Icon: Network/internet symbols with people
Innovation: The revolution of global connectivity through computers and the internet
Significance: Worldwide information sharing and communication breakthrough
Stage 4: Computing Evolution
Icon: AI/computing symbols with data centers
Innovation: The revolution of computational processing through data centers and artificial intelligence
Significance: The dawn of the AI era and advanced computational capabilities
Progress Indicators
Green and blue progress bars show advancement through each evolutionary stage
Each stage maintains the “∞ Infinite” symbol, suggesting unlimited potential at every level
Philosophical Message
“Reaching the Infinite Just only for Human Logics” (Bottom right)
This critical message embodies the game’s central philosophical question:
Can humanity truly overcome or reach the infinite through these innovations?
Even if we approach the infinite, it remains constrained within the boundaries of human perception and logic
Represents both technological optimism and humble acknowledgment of human limitations
Theme
The interface presents a contemplative journey through human technological evolution, questioning whether our innovations truly bring us closer to transcending infinite boundaries, or merely expand the scope of our human-limited understanding.
This image demonstrates the revolutionary applicability of Digital Twin enhanced by LLM integration.
Three Core Components of Digital Twin
Digital Twin consists of three essential elements:
Modeling – Creating digital replicas of physical objects
Data – Real-time sensor data and operational information collection
Simulation – Predictive analysis and scenario testing
Traditional Limitations and LLM’s Revolutionary Solution
Previous Challenges: Modeling results were expressed only through abstract concepts like “Visual Effect” and “Easy to view of complex,” making practical interpretation difficult.
LLM as a Game Changer:
Multimodal Interpretation: Transforms complex 3D models, data patterns, and simulation results into intuitive natural language explanations
Retrieval Interpretation: Instantly extracts key insights from vast datasets and converts them into human-understandable formats
With LLM integration, Digital Twin evolves from a simple visualization tool into an intelligent decision-making partner. This becomes the core driver for maximizing operational efficiency and continuous innovation, accelerating digital transformation across industries.
Ultimately, this diagram emphasizes that LLM is the key technology that unlocks the true potential of Digital Twin, demonstrating its necessity and serving as the foundation for sustained operational improvement and future development.
ESS System Analysis for AI Datacenter Power Control
This diagram illustrates the ESS (Energy Storage System) technology essential for providing flexible high-power supply for AI datacenters. Goldman Sachs Research forecasts that AI will drive a 165% increase in datacenter power demand by 2030, with AI representing about 19% of datacenter power demand by 2028, necessitating advanced power management beyond traditional UPS limitations.
ESS System Features for AI Datacenter Applications
1. High Power Density Battery System
Rapid Charge/Discharge: Immediate response to sudden power fluctuations in AI workloads
Large-Scale Storage: Massive power backup capacity for GPU-intensive AI processing
High Power Density: Optimized for space-constrained datacenter environments
2. Intelligent Power Management Capabilities
Overload Management: Handles instantaneous high-power demands during AI inference/training
GPU Load Prediction: Analyzes AI model execution patterns to forecast power requirements
High Response Speed: Millisecond-level power injection/conversion preventing AI processing interruptions
Predictive Analytics: Machine learning-based power demand forecasting
3. Flexible Operation Optimization
Peak Shaving: Reduces power costs during AI workload peak hours
Load Balancing: Distributes power loads across multiple AI model executions
Renewable Energy Integration: Supports sustainable AI datacenter operations
Cost Optimization: Minimizes AI operational expenses through intelligent power management
Central Power Management System – Essential Core Component of ESS
The Central Power Management System is not merely an auxiliary feature but a critical essential component of ESS for AI datacenters:
1. Precise Data Collection
Real-time monitoring of power consumption patterns by AI workload type
Tracking power usage across GPU, CPU, memory, and other components
Integration of environmental conditions and cooling system power data
Comprehensive telemetry from all datacenter infrastructure elements
2. AI-Based Predictive Analysis
Machine learning algorithms for AI workload prediction
Power demand pattern learning and optimization
Predictive maintenance for failure prevention
Dynamic resource allocation based on anticipated needs
3. Fast Automated Logic
Real-time automated power distribution control
Priority-based power allocation during emergency situations
Coordinated control across multiple ESS systems
Autonomous decision-making for optimal power efficiency
ESS Advantages over UPS for AI Datacenter Applications
While traditional UPS systems are limited to simple backup power during outages, ESS is specifically designed for the complex and dynamic power requirements of AI datacenters:
Proactive vs. Reactive
UPS: Reactive response to power failures
ESS: Proactive management of power demands before issues occur
Intelligence Integration
UPS: Basic power switching functionality
ESS: AI-driven predictive analytics and automated optimization
Scalability and Flexibility
UPS: Fixed capacity backup power
ESS: Dynamic scaling to handle AI servers that use up to 10 times the power of standard servers
Operational Optimization
UPS: Emergency power supply only
ESS: Continuous power optimization, cost reduction, and efficiency improvement
This advanced ESS approach is critical as datacenter capacity has grown 50-60% quarter over quarter since Q1 2023, requiring sophisticated power management solutions that can adapt to the unprecedented energy demands of modern AI infrastructure.
Future-Ready Infrastructure
ESS represents the evolution from traditional backup power to intelligent energy management, essential for supporting the next generation of AI datacenters that demand both reliability and efficiency at massive scale.
Power Consumption Rise: 0.42kW → 1.26kW (3x increase)
Temperature Delta Rise: 7°C → 17°C (increased heat generation)
Cooling System Response:
Water flow rate: 200 LPM → 600 LPM (3x increase)
Fan speed: 600 RPM → 1200 RPM (2x increase)
Operational Prediction Implications
Operating Costs: Approximately 3x increase from baseline expected
Spare Capacity: 40% cooling system capacity remaining
Expansion Capability: Current setup can accommodate additional 67% GPU load
This AI data center monitoring dashboard illustrates the cascading resource changes when GPU workload increases from 30% to 90%, triggering proportional increases in power consumption (3x), cooling flow rate (3x), and fan speed (2x). The system demonstrates predictable operational scaling patterns, with current cooling capacity showing 40% remaining headroom for additional GPU load expansion. Note: All values are estimated figures for demonstration purposes.
Note: All numerical values are estimated figures for demonstration purposes and do not represent actual measured data.