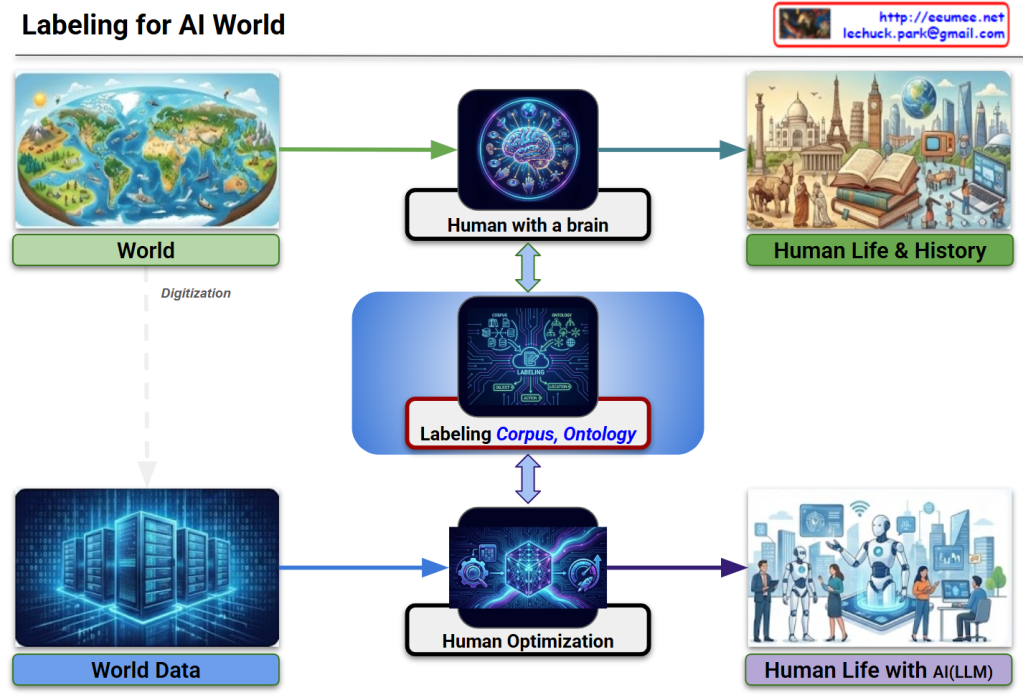
ALL & ChangeD DATA-Driven

Image Analysis: Full Data AI Analysis vs. Change-Triggered Urgent Response

This diagram illustrates a system architecture comparing two core strategies for data processing.

🎯 Core 1: Two Data Processing Approaches

Approach A: Full Data Processing (Analysis)

  • All Data path (blue)
  • Collects and comprehensively analyzes all data
  • Performs in-depth analysis through Deep Analysis
  • AI-powered statistical change (Stat of changes) analysis
  • Characteristics: Identifies overall patterns, trends, and correlations

Approach B: Separate Change Detection Processing

  • Change Only path (yellow)
  • Selectively detects only changes
  • Extracts and processes only deltas (differences)
  • Characteristics: Fast response time, efficient resource utilization

🔥 Core 2: Analysis→Urgent Response→Expert Processing Flow

Stage 1: Analysis

  • Full Data Analysis: AI-based Deep Analysis
  • Change Detection: Change Only monitoring

Stage 2: Urgent Response (Urgent Event)

  • Immediate alert generation when changes detected (⚠️ Urgent Event)
  • Automated primary response process execution
  • Direct linkage to Work Process

Stage 3: Expert Processing (Expert Make Rules)

  • Human expert intervention
  • Integrated review of AI analysis results + urgent event information
  • Creation and modification of situation-appropriate rules
  • Work Process optimization

🔄 Integrated Process Flow

[Data Collection] 
    ↓
[Path Bifurcation]
    ├─→ [All Data] → [Deep Analysis] ─┐
    │                                  ├→ [AI Statistical Analysis]
    └─→ [Change Only] → [Urgent Event]─┘
                            ↓
                    [Work Process] ↔ [Expert Make Rules]
                            ↑_____________↓
                         (Feedback loop with AI)

💡 Core System Value

  1. Dual Processing Strategy: Stability (full analysis) + Agility (change detection)
  2. 3-Stage Response System: Automated analysis → Urgent process → Expert judgment
  3. AI + Human Collaboration: Combines AI analytical power with human expert judgment
  4. Continuous Improvement: Virtuous cycle where expert rules feed back into AI learning

This system is an architecture optimized for environments where real-time response is essential while expert judgment remains critical (manufacturing, infrastructure operations, security monitoring, etc.).


Summary

  1. Dual-path system: Comprehensive full data analysis (stability) + selective change detection (speed) working in parallel
  2. Three-tier response: AI automated analysis triggers urgent events, followed by work processes and expert rule refinement
  3. Human-AI synergy: Continuous improvement loop where expert knowledge enhances AI capabilities while AI insights inform expert decisions

#DataArchitecture #AIAnalysis #EventDrivenArchitecture #RealTimeMonitoring #HybridProcessing #ExpertSystems #ChangeDetection #UrgentResponse #IndustrialAI #SmartMonitoring #DataProcessing #AIHumanCollaboration #PredictiveMaintenance #IoTArchitecture #EnterpriseAI

Operations by Metrics

1. Big Data Collection & 2. Quality Verification

  • Big Data Collection: Represented by the binary data (top-left) and the “All Data (Metrics)” block (bottom-left).
  • Data Quality Verification: The collected data then passes through the checklist icon (top flow) and the “Verification (with Resolution)” step (bottom flow). This aligns with the quality verification step, including ‘resolution/performance’.

3. Change Data Capture (CDC)

  • Verified data moves to the “Change Only” stage (central pink box).
  • If there are “No Changes,” it results in “No Actions,” illustrating the CDC (Change Data Capture) concept of processing only altered data.
  • The magnifying glass icon in the top flow also visualizes this ‘change detection’ role.

4. State/Numeric Processing & 5. Analysis, Severity Definition

  • State/Numeric Processing: Once changes are detected (after the magnifying glass), the data is split into two types:
    • State Changes (ON/OFF icon): Represents changes in ‘state values’.
    • Numeric Changes (graph icon): Represents changes in ‘numeric values’.
  • Statistical Analysis & Severity Definition:
    • These changes are fed into the “Analysis” step.
    • This stage calculates the “Count of Changes” (statistics on the number of changes) and “Numeric change Diff” (amount of numeric change).
    • The analysis result leads to “Severity Tagging” to define the ‘Severity’ level (e.g., “Critical? Major? Minor?”).

6. Notification & 7. Analysis (Retrieve)

  • Notification: Once the severity is defined, the “Notification” step (bell/email icon) is triggered to alert personnel.
  • Analysis (Retrieve):
    • The notified user then performs the “Retrieve” action.
    • This final step involves querying both the changed data (CDD results) and the original data (source, indicated by the URL in the top-right) to analyze the cause.

Summary

This workflow begins with collecting and verifying all data, then uses CDC to isolate only the changes. These changes (state or numeric) are analyzed for count and difference to assign a severity level. The process concludes with notification and a retrieval step for root cause analysis.

#DataProcessing #DataMonitoring #ChangeDataCapture #CDC #DataAnalysis #SystemMonitoring #Alerting #ITOperations #SeverityAnalysis

With Gemini

Big Changes with AI

This image illustrates the dramatic growth in computing performance and data throughput from the Internet era to the AI/LLM era.

Key Development Stages

1. Internet Era

  • 10 TWh (terawatt-hours) power consumption
  • 2 PB/day (petabytes/day) data processing
  • 1K DC (1,000 data centers)
  • PUE 3.0 (Power Usage Effectiveness)

2. Mobile & Cloud Era

  • 200 TWh (20x increase)
  • 20,000 PB/day (10,000x increase)
  • 4K DC (4x increase)
  • PUE 1.8 (improved efficiency)

3. AI/LLM (Transformer) Era – “Now Here?” point

  • 400+ TWh (40x additional increase)
  • 1,000,000,000 PB/day = 1 billion PB/day (500,000x increase)
  • 12K DC (12x increase)
  • PUE 1.4 (further improved efficiency)

Summary

The chart demonstrates unprecedented exponential growth in data processing and power consumption driven by AI and Large Language Models. While data center efficiency (PUE) has improved significantly, the sheer scale of computational demands has skyrocketed. This visualization emphasizes the massive infrastructure requirements that modern AI systems necessitate.

#AI #LLM #DataCenter #CloudComputing #MachineLearning #ArtificialIntelligence #BigData #Transformer #DeepLearning #AIInfrastructure #TechTrends #DigitalTransformation #ComputingPower #DataProcessing #EnergyEfficiency

Programming … AI

This image contrasts traditional programming, where developers must explicitly code rules and logic (shown with a flowchart and a thoughtful programmer), with AI, where neural networks automatically learn patterns from large amounts of data (depicted with a network diagram and a smiling programmer). It illustrates the paradigm shift from manually defining rules to machines learning patterns autonomously from data.

#AI #MachineLearning #Programming #ArtificialIntelligence #AIvsTraditionalProgramming

Evolution … Changes

Evolution and Changes: Navigating Through Transformation

Overview:

Main Graph (Blue Curve)

  • Shows the pattern of evolutionary change transitioning from gradual growth to exponential acceleration over time
  • Three key developmental stages are marked with distinct points

Three-Stage Development Process:

Stage 1: Initial Phase (Teal point and box – bottom left)

  • Very gradual and stable changes
  • Minimal volatility with a flat curve
  • Evolutionary changes are slow and predictable
  • Response Strategy: Focus on incremental improvements and stable maintenance

Stage 2: Intermediate Phase (Yellow point and box – middle)

  • Fluctuations begin to emerge
  • Volatility increases but remains limited
  • Transitional period showing early signs of change
  • Response Strategy: Detect change signals and strengthen preparedness

Stage 3: Turbulent Phase (Red point and box on right – top)

  • Critical turning point where exponential growth begins
  • Volatility maximizes with highly irregular and large-amplitude changes
  • The red graph on the right details the intense and frequent fluctuations during this period
  • Characterized by explosive and unpredictable evolutionary changes
  • Response Imperative: Rapid and flexible adaptation is essential for survival in the face of high volatility and dramatic shifts

Key Message:

Evolution progresses through stable initial phases → emerging changes in the intermediate period → explosive transformation in the turbulent phase. During the turbulent phase, volatility peaks, making the ability to anticipate and actively respond critical for survival and success. Traditional stable approaches become obsolete; rapid adaptation and innovative transformation become essential.


#Evolution #Change #Transformation #Adaptation #Innovation #DigitalTransformation

With Claude

AI goes exponentially with ..

This infographic illustrates how AI’s exponential growth triggers a cascading exponential expansion across all interconnected domains.

Core Concept: Exponential Chain Reaction

Top Process Chain: AI’s exponential growth creates proportionally exponential demands at each stage:

  • AI (LLM)DataComputingPowerCooling

The “≈” symbol indicates that each element grows exponentially in proportion to the others. When AI doubles, the required data, computing, power, and cooling all scale proportionally.

Evidence of Exponential Growth Across Domains

1. AI Networking & Global Data Generation (Top Left)

  • Exponential increase beginning in the 2010s
  • Vertical surge post-2020

2. Data Center Electricity Demand (Center Left)

  • Sharp increase projected between 2026-2030
  • Orange (AI workloads) overwhelms blue (traditional workloads)
  • AI is the primary driver of total power demand growth

3. Power Production Capacity (Center Right)

  • 2005-2030 trends across various energy sources
  • Power generation must scale alongside AI demand

4. AI Computing Usage (Right)

  • Most dramatic exponential growth
  • Modern AI era begins in 2012
  • Doubling every 6 months (extremely rapid exponential growth)
  • Over 300,000x increase since 2012
  • Three exponential growth phases shown (1e+0, 1e+2, 1e+4, 1e+6)

Key Message

This infographic demonstrates that AI development is not an isolated phenomenon but triggers exponential evolution across the entire ecosystem:

  • As AI models advance → Data requirements grow exponentially
  • As data increases → Computing power needs scale exponentially
  • As computing expands → Power consumption rises exponentially
  • As power consumption grows → Cooling systems must expand exponentially

All elements are tightly interconnected, creating a ‘cascading exponential effect’ where exponential growth in one domain simultaneously triggers exponential development and demand across all other domains.


#ArtificialIntelligence #ExponentialGrowth #AIInfrastructure #DataCenters #ComputingPower #EnergyDemand #TechScaling #AIRevolution #DigitalTransformation #Sustainability #TechInfrastructure #MachineLearning #LLM #DataScience #FutureOfAI #TechTrends #TechnologyEvolution

With Claude

Resolution is Speed

Resolution is Speed: Data Resolution Strategy in Rapidly Changing Environments

Core Concept

When facing rapid changes and challenges, increasing data resolution is the key strategy to maximize problem-solving speed. While low-resolution data may suffice in stable, low-change situations, high-resolution data becomes essential in complex, volatile environments.

Processing Framework

  1. High Resolution Sensing: Fine-grained detection of changing environments
  2. Computing Foundation: Securing basic computing capabilities to quantify high-resolution data
  3. Big Data Processing: Rapid processing of large-scale, high-resolution data
  4. AI Amplification: Maximizing big data processing capabilities through AI assistance

Resulting Benefits

Through this high-resolution data processing approach:

  • Fast Reaction Available: Enables rapid response to changes
  • More Stable and Efficient: Achieves real stability and efficiency
  • Attains predictable and controllable states even in highly volatile environments

Real-world Application and Necessity

These changes and challenges are occurring continuously, and AI Data Centers (AI DCs) must become the physical embodiment of rapid change response through high-resolution data processing—this is an urgent imperative. The construction and operation of AI DCs is not an option but a survival necessity, representing essential infrastructure that must be established to maintain competitiveness in the rapidly evolving digital landscape.

#DataResolution #AIDataCenter #BusinessAgility #TechImperative #FutureReady

With Claude