
The Computing for the Fair Human Life.
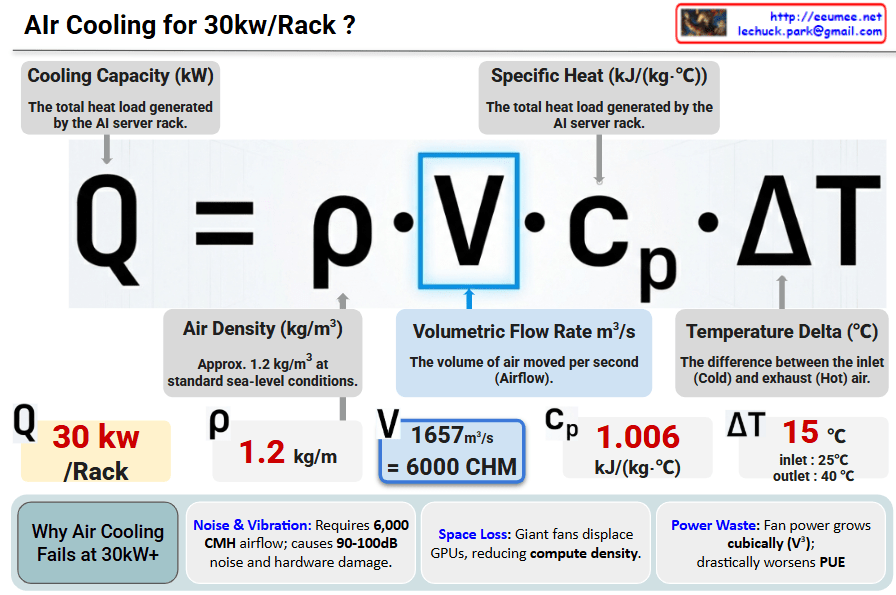
Conclusion: At 30kW/Rack, air cooling hits a physical and economic “wall”. Transitioning to Liquid Cooling is mandatory for next-generation AI Data Centers.
#AIDataCenter #LiquidCooling #ThermalManagement #30kWRack #DataCenterEfficiency #PUE #HighDensityComputing #GPUCooling
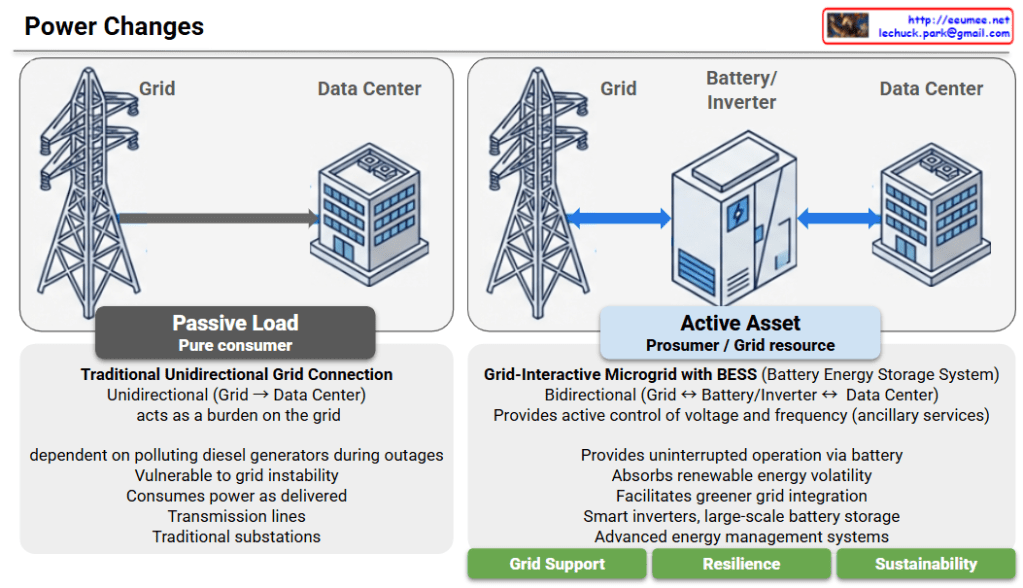
Power Architecture Evolution: From Passive Load to Active Asset
This diagram illustrates the critical evolution of data center power systems, highlighting the shift from a traditional “Passive Load” model to an “Active Asset” model. This transition is emerging as an essential power architecture and strategic direction for future AI Data Centers (AI DCs), which demand massive energy consumption and absolute operational stability.
1. AS-IS: Passive Load (Pure Consumer)
2. TO-BE: Active Asset (Prosumer / Grid Resource)
Conclusion: An Indispensable Power Direction for AI DCs
Rather than simply acting as facilities that drain massive amounts of electricity, modern data centers must evolve into grid-interactive assets. Given the exponential surge in power demands and the strict continuous operation requirements of AI workloads, adopting this “Active Asset” architecture with BESS and smart inverters is no longer just an eco-friendly alternative—it is an essential and inevitable power infrastructure direction for the successful deployment and scaling of AI Data Centers.
#AIDC #AIDataCenter #DataCenterInfrastructure #ESS #Inverter #GridInteractive
With Gemini
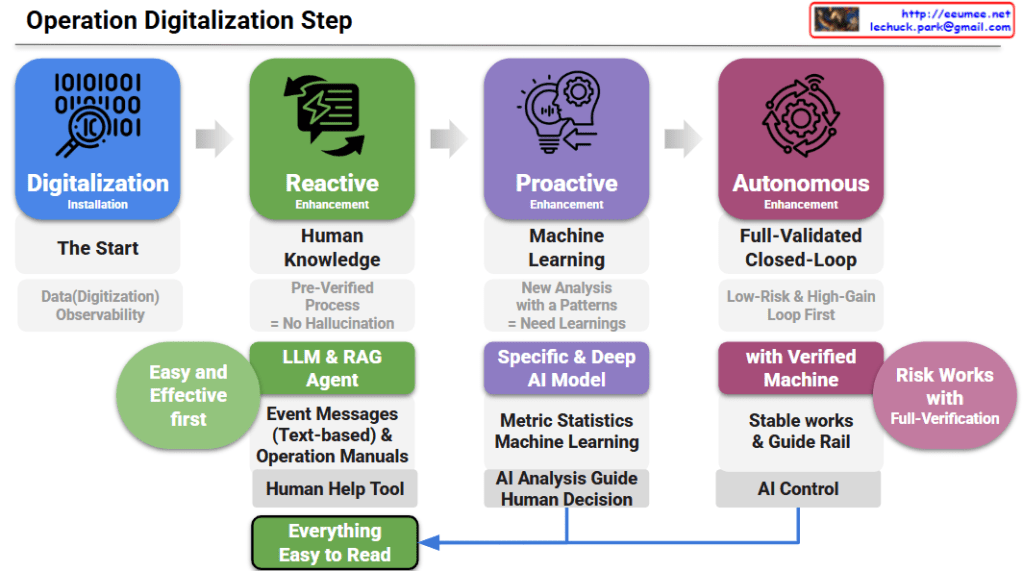
Step 1: Digitalization (The Start)
Step 2: Reactive Enhancement (Human Knowledge)
Step 3: Proactive Enhancement (Machine Learning)
Step 4: Autonomous Enhancement (Full-Validated Closed-Loop)
#OperationDigitalization #AIOps #AutonomousOperations #DataCenterManagement #ITInfrastructure #LLM #RAG #MachineLearning #DigitalTransformation
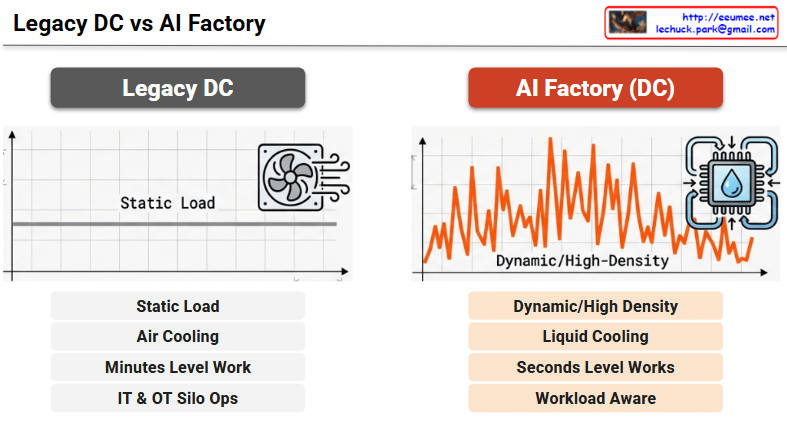
1. Legacy Data Center
2. AI Factory (DC)
#AIFactory #DataCenter #LiquidCooling #WorkloadAware #ITOTConvergence #HighFidelityData #Digitalization #AIInfrastructure
With Gemini