Multi-DCs Operation with a LLM (4)

LLM-Based Multi-Datacenter Operation System
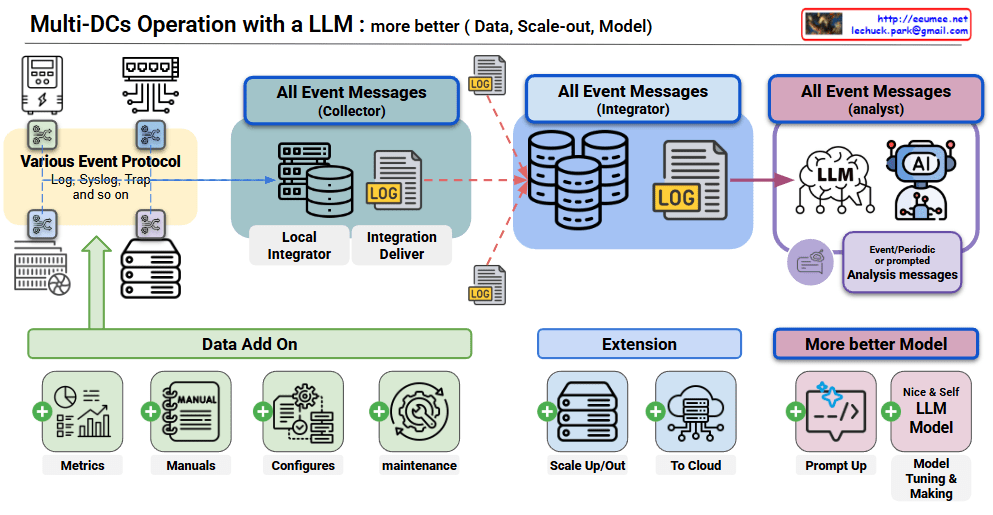
System Architecture

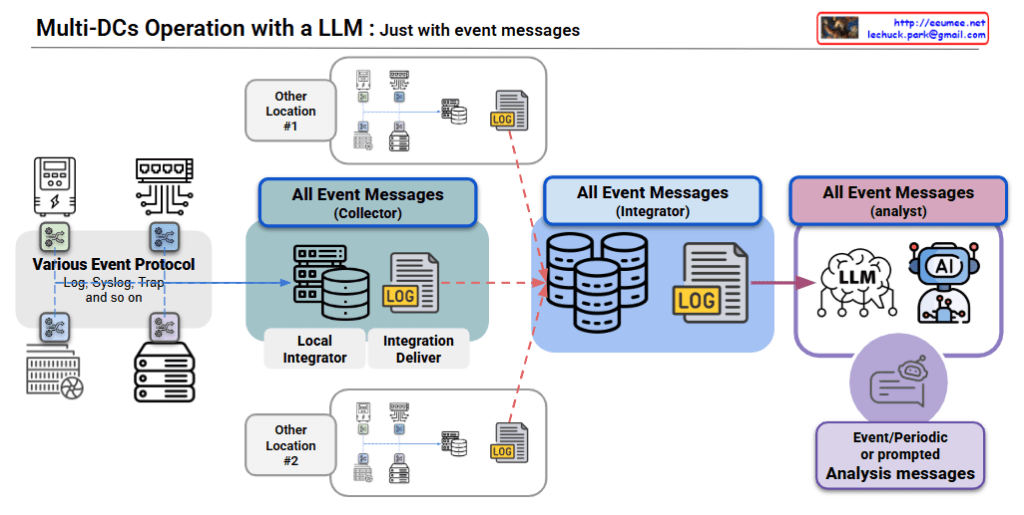
3-Stage Processing Pipeline: Collector → Integrator → Analyst

  • Event collection from various protocols
  • Data normalization through local integrators
  • Intelligent analysis via LLM/AI analyzers
  • RAG data expansion through bottom Data Add-On modules

Core Functions

1. Time-Based Event Aggregation Analysis

  • 60-second intervals (adjustable) for event bundling
  • Comprehensive situational analysis instead of individual alarms
  • LLM queries with predefined prompts

Effectiveness:

  • ✅ Resolves alarm fatigue and enables correlation analysis
  • ✅ Improves operational efficiency through periodic comprehensive reports
  • ⚠️ Potential delay in immediate response to critical issues ( -> Using a legacy/local monitoring system )

2. RAG-Based Data Enhancement

  • Extension data: Metrics, manuals, configurations, maintenance records
  • Reuse of past analysis results as learning data
  • Improved accuracy through domain-specific knowledge accumulation

Effectiveness:

  • ✅ Continuous improvement of analysis quality and increased automation
  • ✅ Systematization of operational knowledge and organizational capability enhancement

Innovative Value

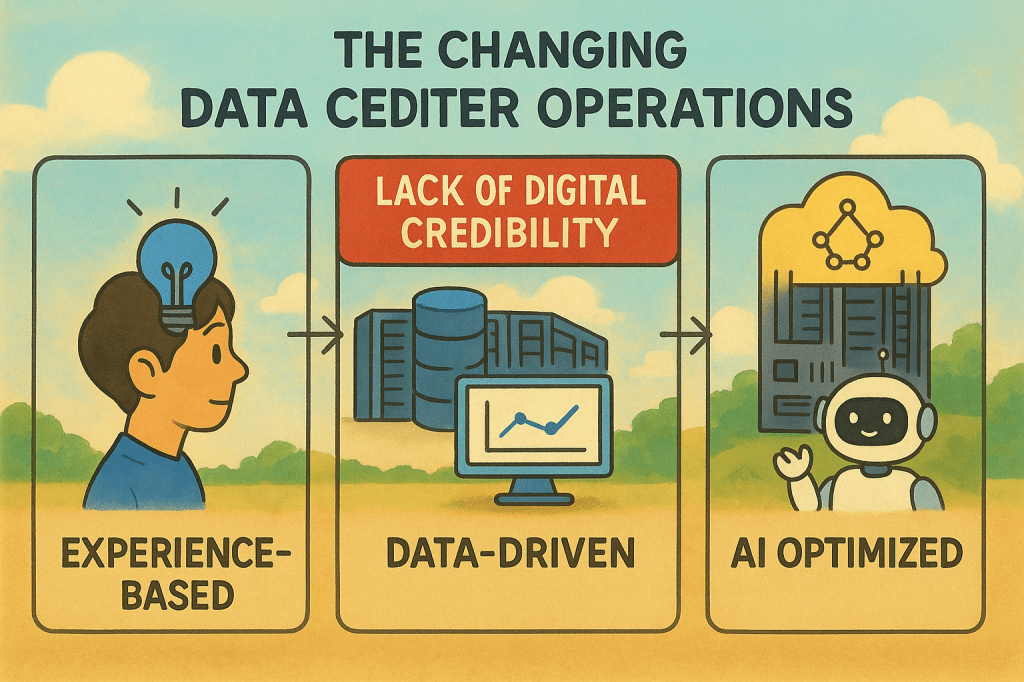
  • Paradigm Shift: Reactive → Predictive/Contextual analysis
  • Operational Burden Reduction: Transform massive alarms into meaningful insights
  • Self-Evolution: Continuous learning system through RAG framework

Executive Summary: This system overcomes the limitations of traditional individual alarm approaches and represents an innovative solution that intelligentizes datacenter operations through time-based event aggregation and LLM analysis. As a self-evolving monitoring system that continuously learns and develops through RAG-based data enhancement, it is expected to dramatically improve operational efficiency and analysis accuracy.

With Claude

Multi-DCs Operation with a LLM(3)

This diagram presents the 3 Core Expansion Strategies for Event Message-based LLM Data Center Operations System.

System Architecture Overview

Basic Structure:

  • Collects event messages from various event protocols (Log, Syslog, Trap, etc.)
  • 3-stage processing pipeline: Collector → Integrator → Analyst
  • Final stage performs intelligent analysis using LLM and AI

3 Core Expansion Strategies

1️⃣ Data Expansion (Data Add On)

Integration of additional data sources beyond Event Messages:

  • Metrics: Performance indicators and metric data
  • Manuals: Operational manuals and documentation
  • Configures: System settings and configuration information
  • Maintenance: Maintenance history and procedural data

2️⃣ System Extension

Infrastructure scalability and flexibility enhancement:

  • Scale Up/Out: Vertical/horizontal scaling for increased processing capacity
  • To Cloud: Cloud environment expansion and hybrid operations

3️⃣ LLM Model Enhancement (More Better Model)

Evolution toward DC Operations Specialized LLM:

  • Prompt Up: Data center operations-specialized prompt engineering
  • Nice & Self LLM Model: In-house development of DC operations specialized LLM model construction and tuning

Strategic Significance

These 3 expansion strategies present a roadmap for evolving from a simple event log analysis system to an Intelligent Autonomous Operations Data Center. Particularly, through the development of in-house DC operations specialized LLM, the goal is to build an AI system that achieves domain expert-level capabilities specifically tailored for data center operations, rather than relying on generic AI tools.

With Claude

go with : the best efficient

System Operations Strategy: Stabilize vs Optimize Analysis

Graph Components

Operational Performance Levels (Color-coded meanings):

  • Blue Line: Risk Zone – Abnormal operational state requiring urgent intervention
  • Green Line: Stable and efficient ideal operational range
  • Purple Line: Enhanced high-performance operational state
  • Dark Red Line: Fully optimized peak performance state
  • Gray Line: Conservative stable operation (high cost consumption)

Core Operating Philosophy

Phase 1: Stabilize

Objective: keep <Green> higher than <Blue>

  • Meaning: Build defense mechanisms to prevent system from falling below risk zone (blue)
  • Impact: Prevent failures, ensure service continuity
  • Approach: Proactive response through predictive-based prevention, prioritizing stability

Phase 2: Optimize

Objective: move <Green> to <Red>

  • Meaning: Gradual performance improvement on a stabilized foundation
  • Impact: Simultaneous improvement of cost efficiency and operational performance
  • Approach: Pursue optimization within limits that don’t compromise stability

Strategic Insights

1. Importance of Sequential Approach

  • The Stabilize → Optimize sequence is essential
  • Direct optimization without stabilization increases risk exposure

2. Cost Efficiency Paradox

  • Stable efficiency (green) is practically more valuable than full optimization (red)
  • Excessive optimization can result in diminishing returns on investment

3. Dynamic Equilibrium Maintenance

  • Green zone represents a dynamic benchmark continuously adjusted upward, not a fixed target
  • Balance point between stability and efficiency must be continuously recalibrated based on environmental changes

Practical Implications

This model visualizes the core principle of modern system operations: “Stability is the prerequisite for efficiency.” Rather than pursuing performance improvements alone, it presents strategic guidelines for achieving genuine operational efficiency through gradual and sustainable optimization built upon a solid foundation of stability.

The framework emphasizes that true operational excellence comes not from aggressive optimization, but from maintaining the optimal balance between risk mitigation and performance enhancement, ensuring long-term business value creation through sustainable operational practices.

With Claude

Multi-DCs Operation with a LLM (1)

This diagram illustrates a Multi-Data Center Operations Architecture leveraging LLM (Large Language Model) with Event Messages.

Key Components

1. Data Collection Layer (Left Side)

  • Collects data from various sources through multiple event protocols (Log, Syslog, Trap, etc.)
  • Gathers event data from diverse servers and network equipment

2. Event Message Processing (Center)

  • Collector: Comprises Local Integrator and Integration Deliver to process event messages
  • Integrator: Manages and consolidates event messages in a multi-database environment
  • Analyst: Utilizes AI/LLM to analyze collected event messages

3. Multi-Location Support

  • Other Location #1 and #2 maintain identical structures for event data collection and processing
  • All location data is consolidated for centralized analysis

4. AI-Powered Analysis (Right Side)

  • LLM: Intelligently analyzes all collected event messages
  • Event/Periodic or Prompted Analysis Messages: Generates automated alerts and reports based on analysis results

System Characteristics

This architecture represents a modern IT operations management solution that monitors and manages multi-data center environments using event messages. The system leverages LLM technology to intelligently analyze large volumes of log and event data, providing operational insights for enhanced data center management.

The key advantage is the unified approach to handling diverse event streams across multiple locations while utilizing AI capabilities for intelligent pattern recognition and automated response generation.

With Claude

Data Center ?

This infographic compares the evolution from servers to data centers, showing the progression of IT infrastructure complexity and operational requirements.

Left – Server

  • Shows individual hardware components: CPU, motherboard, power supply, cooling fans
  • Labeled “No Human Operation,” indicating basic automated functionality

Center – Modular DC

  • Represented by red cubes showing modular architecture
  • Emphasizes “More Bigger” scale and “modular” design
  • Represents an intermediate stage between single servers and full data centers

Right – Data Center

  • Displays multiple server racks and various infrastructure components (networking, power, cooling systems)
  • Marked as “Human & System Operation,” suggesting more complex management requirements

Additional Perspective on Automation Evolution:

While the image shows data centers requiring human intervention, the actual industry trend points toward increasing automation:

  1. Advanced Automation: Large-scale data centers increasingly use AI-driven management systems, automated cooling controls, and predictive maintenance to minimize human intervention.
  2. Lights-Out Operations Goal: Hyperscale data centers from companies like Google, Amazon, and Microsoft ultimately aim for complete automated operations with minimal human presence.
  3. Paradoxical Development: As scale increases, complexity initially requires more human involvement, but advanced automation eventually enables a return toward unmanned operations.

Summary: This diagram illustrates the current transition from simple automated servers to complex data centers requiring human oversight, but the ultimate industry goal is achieving fully automated “lights-out” data center operations. The evolution shows increasing complexity followed by sophisticated automation that eventually reduces the need for human intervention.

With Claude

Data Center Operantions

Data center operations are shifting from experience-driven practices toward data-driven and AI-optimized systems.
However, a fundamental challenge persists: the lack of digital credibility.

  • Insufficient data quality: Incomplete monitoring data and unreliable hardware reduce trust.
  • Limited digital expertise of integrators: Many providers focus on traditional design/operations, lacking strong datafication and automation capabilities.
  • Absence of verification frameworks: No standardized process to validate or certify collected data and analytical outputs.

These gaps are amplified by the growing scale and complexity of data centers and the expansion of GPU adoption, making them urgent issues that must be addressed for the next phase of digital operations.

Operations : Changes Detection and then

Process Analysis from “Change Drives Operations” Perspective

Core Philosophy

“No Change, No Operation” – This diagram illustrates the fundamental IT operations principle that operations are driven by change detection.

Change-Centric Operations Framework

1. Change Detection as the Starting Point of All Operations

  • Top-tier monitoring systems continuously detect changes
  • No Changes = No Operations (left gray boxes)
  • Change Detected = Operations Initiated (blue boxes)

2. Operational Strategy Based on Change Characteristics

Change Detection → Operational Need Assessment → Appropriate Response
  • Normal Changes → Standard operational activities
  • Anomalies → Immediate response operations
  • Real-time Events → Emergency operational procedures

3. Cyclical Structure Based on Operational Outcomes

  • Maintenance: Stable operations maintained through proper change management
  • Fault/Big Cost: Increased costs due to inadequate response to changes

Key Insights

“Change Determines Operations”

  1. System without change = No intervention required
  2. System with change = Operational activity mandatory
  3. Early change detection = Efficient operations
  4. Proper change classification = Optimized resource allocation

Operational Paradigm

This diagram demonstrates the evolution from Reactive Operations to Proactive Operations, where:

  • Traditional Approach: Wait for problems → React
  • Modern Approach: Detect changes → Predict → Respond proactively

The framework recognizes change as the trigger for all operational activities, embodying the contemporary IT operations paradigm where:

  • Operations are event-driven rather than schedule-driven
  • Intelligence (AI/Analytics) transforms raw change data into actionable insights
  • Automation ensures appropriate responses to different types of changes

This represents a shift toward Change-Driven Operations Management, where the operational workload directly correlates with the rate and nature of system changes, enabling more efficient resource utilization and better service reliability.

With Claude