PG25 Metrics

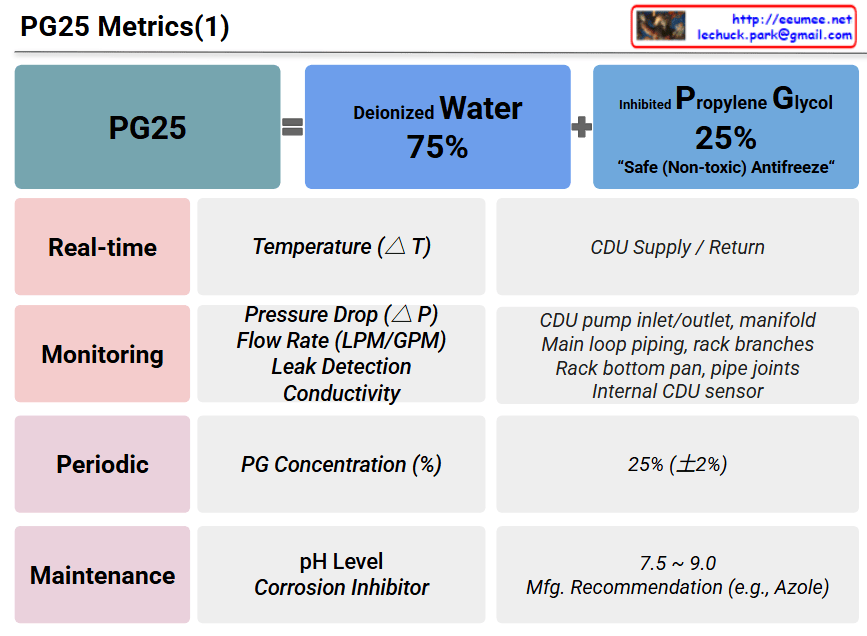
This image file (image_a2495a.png) is a presentation slide titled “PG25 Metrics(1).” It explains the chemical composition of PG25, a cooling fluid often used in liquid cooling systems, and details the key metrics required to manage it effectively.

1. Composition of PG25 (Top Section)

  • PG25 is defined as a mixture of two primary components.
  • Deionized Water: 75%
  • Inhibited Propylene Glycol: 25%
  • This specific formula is described as a “Safe (Non-toxic) Antifreeze.”

2. Management Metrics (Bottom Table)

The table below categorizes the management metrics into four distinct phases based on frequency and purpose:

  • Real-time:
    • Metrics: Temperature change ($\Delta T$)
    • Location/Reference: CDU (Coolant Distribution Unit) Supply / Return lines
  • Monitoring:
    • Metrics: Pressure Drop ($\Delta P$), Flow Rate (LPM/GPM), Leak Detection, and Conductivity
    • Location/Reference: CDU pump inlet/outlet and manifold, Main loop piping and rack branches, Rack bottom pan and pipe joints, Internal CDU sensor
  • Periodic:
    • Metrics: PG (Propylene Glycol) Concentration (%)
    • Location/Reference: Maintained at 25% ($\pm 2\%$)
  • Maintenance:
    • Metrics: pH Level, Corrosion Inhibitor
    • Location/Reference: pH level kept between 7.5 and 9.0; Corrosion inhibitors managed per Manufacturer’s Recommendation (e.g., Azole)

📝 Summary

This slide provides a systematic guide for maintaining the optimal condition of PG25 cooling fluid (75% Deionized Water + 25% Propylene Glycol) used in liquid cooling applications. It breaks down the fluid management process into Real-time, Monitoring, Periodic, and Maintenance phases, clearly outlining the essential metrics (temperature, pressure, flow rate, concentration, pH) and target values for each stage.

#PG25 #LiquidCooling #Coolant #DataCenter #ServerCooling #Maintenance #Monitoring #Antifreeze

With Gemini

Operations : Changes Detection and then

Process Analysis from “Change Drives Operations” Perspective

Core Philosophy

“No Change, No Operation” – This diagram illustrates the fundamental IT operations principle that operations are driven by change detection.

Change-Centric Operations Framework

1. Change Detection as the Starting Point of All Operations

  • Top-tier monitoring systems continuously detect changes
  • No Changes = No Operations (left gray boxes)
  • Change Detected = Operations Initiated (blue boxes)

2. Operational Strategy Based on Change Characteristics

Change Detection → Operational Need Assessment → Appropriate Response
  • Normal Changes → Standard operational activities
  • Anomalies → Immediate response operations
  • Real-time Events → Emergency operational procedures

3. Cyclical Structure Based on Operational Outcomes

  • Maintenance: Stable operations maintained through proper change management
  • Fault/Big Cost: Increased costs due to inadequate response to changes

Key Insights

“Change Determines Operations”

  1. System without change = No intervention required
  2. System with change = Operational activity mandatory
  3. Early change detection = Efficient operations
  4. Proper change classification = Optimized resource allocation

Operational Paradigm

This diagram demonstrates the evolution from Reactive Operations to Proactive Operations, where:

  • Traditional Approach: Wait for problems → React
  • Modern Approach: Detect changes → Predict → Respond proactively

The framework recognizes change as the trigger for all operational activities, embodying the contemporary IT operations paradigm where:

  • Operations are event-driven rather than schedule-driven
  • Intelligence (AI/Analytics) transforms raw change data into actionable insights
  • Automation ensures appropriate responses to different types of changes

This represents a shift toward Change-Driven Operations Management, where the operational workload directly correlates with the rate and nature of system changes, enabling more efficient resource utilization and better service reliability.

With Claude

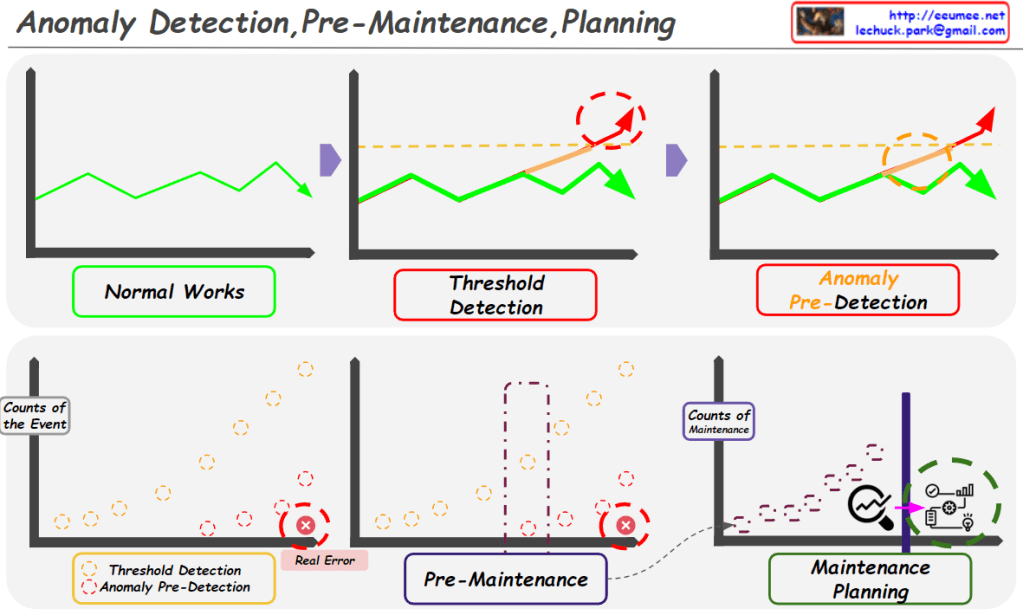
Anomaly Detection,Pre-Maintenance,Planning

From Claude with some prompting
This image illustrates the concepts of Anomaly Detection, Pre-Maintenance, and Planning in system or equipment management.

Top section:

  1. “Normal Works”: Shows a graph representing normal operational state.
  2. “Threshold Detection”: Depicts the stage where anomalies exceeding a threshold are detected.
  3. “Anomaly Pre-Detection”: Illustrates the stage of detecting anomalies before they reach the threshold.

Bottom section:

  1. “Threshold Detection Anomaly Pre-Detection”: A graph showing both threshold detection and pre-detection of anomalies. It captures anomalies before a real error occurs.
  2. “Pre-Maintenance”: Represents the pre-maintenance stage, where maintenance work is performed after anomalies are detected.
  3. “Maintenance Planning”: Shows the maintenance planning stage, indicating continuous monitoring and scheduled maintenance activities.

The image demonstrates the process of:

  • Detecting anomalies early in normal system operations
  • Implementing pre-maintenance to prevent actual errors
  • Developing systematic maintenance plans

This visual explanation emphasizes the importance of proactive monitoring and maintenance to prevent failures and optimize system performance.