Resolution is Speed: Data Resolution Strategy in Rapidly Changing Environments
Core Concept
When facing rapid changes and challenges, increasing data resolution is the key strategy to maximize problem-solving speed. While low-resolution data may suffice in stable, low-change situations, high-resolution data becomes essential in complex, volatile environments.
Processing Framework
- High Resolution Sensing: Fine-grained detection of changing environments
- Computing Foundation: Securing basic computing capabilities to quantify high-resolution data
- Big Data Processing: Rapid processing of large-scale, high-resolution data
- AI Amplification: Maximizing big data processing capabilities through AI assistance
Resulting Benefits
Through this high-resolution data processing approach:
- Fast Reaction Available: Enables rapid response to changes
- More Stable and Efficient: Achieves real stability and efficiency
- Attains predictable and controllable states even in highly volatile environments
Real-world Application and Necessity
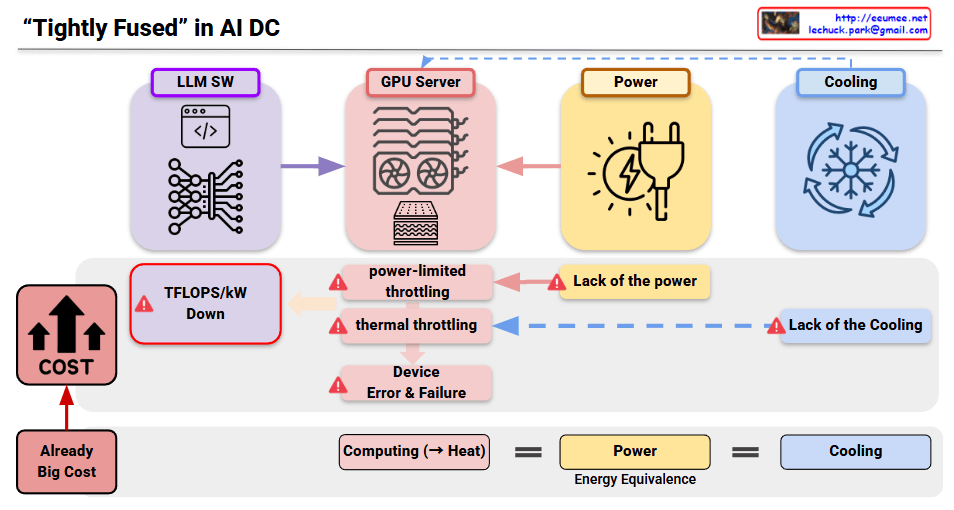
These changes and challenges are occurring continuously, and AI Data Centers (AI DCs) must become the physical embodiment of rapid change response through high-resolution data processing—this is an urgent imperative. The construction and operation of AI DCs is not an option but a survival necessity, representing essential infrastructure that must be established to maintain competitiveness in the rapidly evolving digital landscape.
#DataResolution #AIDataCenter #BusinessAgility #TechImperative #FutureReady
With Claude