From Claude with some prompting The image illustrates the role of a Data Processing Unit (DPU) in facilitating seamless and delay-free data exchange between different hardware components such as the GPU, NVME (likely referring to an NVMe solid-state drive), and other devices.
The key highlight is that the DPU enables “Data Exchange Parallely without a Delay” and provides “Seamless” connectivity between these components. This means the DPU acts as a high-speed interconnect, allowing parallel data transfers to occur without any bottlenecks or latency.
The image emphasizes the DPU’s ability to provide a low-latency, high-bandwidth data processing channel, enabling efficient data movement and processing across various hardware components within a system. This seamless connectivity and delay-free data exchange are crucial for applications that require intensive data processing, such as data analytics, machine learning, or high-performance computing, where minimizing latency and maximizing throughput are critical.
==================
The key features of the DPU highlighted in the image are:
Data Exchange Parallely: The DPU allows parallel data exchange without delay or bottlenecks, enabling seamless data transfer.
Interconnection: The DPU interconnects different components like the GPU, NVME, and other devices, facilitating efficient data flow between them.
The DPU aims to provide a high-speed, low-latency data processing channel, enabling efficient data movement and computation between various hardware components in a system. This can be particularly useful in applications that require intensive data processing, such as data analytics, machine learning, or high-performance computing.Cop
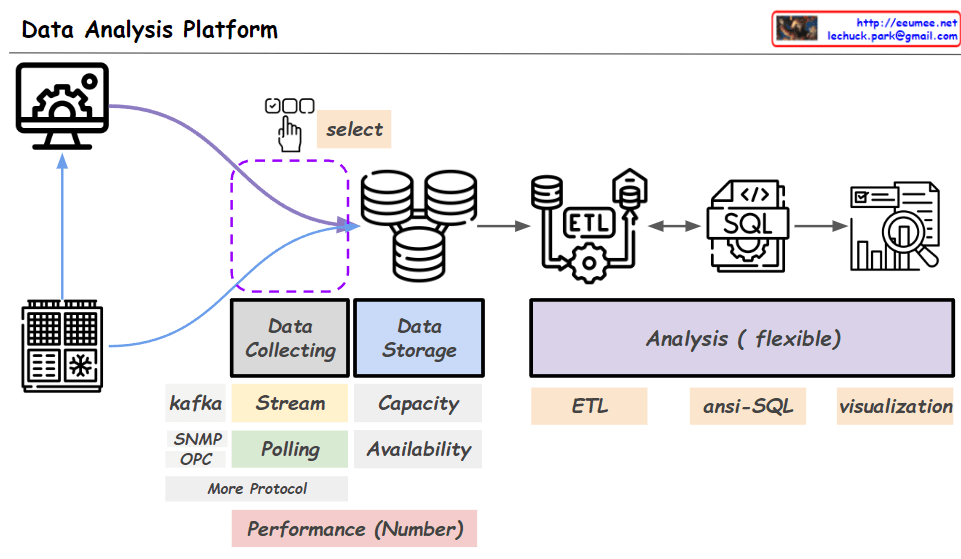
From Claude with some prompting The given image illustrates the overall architecture of a data analysis platform. At the data collecting stage, data is gathered from actual equipment or systems (servers). Protocols like Kafka, SNMP, and OPC are used for data streaming or polling.
The ‘select’ part indicates selecting specific data from the entire collected dataset. Based on the configuration information of the actual equipment, only the data of interest can be selectively collected, allowing the expansion of the data collection scope.
The selected data is stored in a data storage system and then loaded into an SQL database through an ETL (Extract, Transform, Load) process. Afterward, flexible data analysis is enabled using tools like ETL, ansi-SQL, and visualization.
Performance metrics for the entire process are provided numerically, and analysis tasks can be performed through the user interface of the data analysis platform.
The key aspects highlighted are the collection of data from actual equipment/systems, selective data collection based on equipment configuration, data storage, ETL process, SQL database, analysis tools (ETL, SQL, visualization), performance metrics, and the analysis platform user interface.
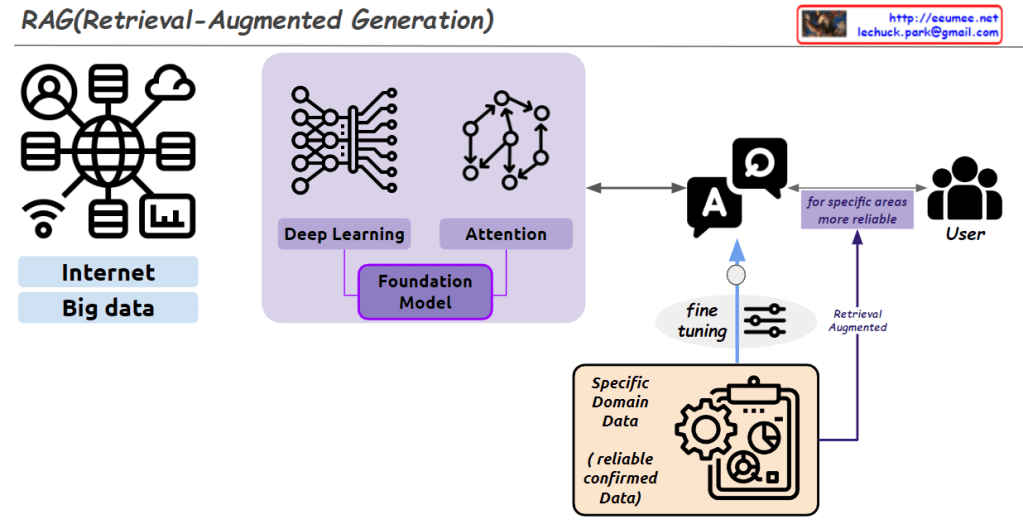
From Claude with some prompting This image explains the concept and structure of the RAG (Retrieval-Augmented Generation) model.
First, a large amount of data is collected from the “Internet” and “Big Data” to train a Foundation Model. This model utilizes Deep Learning and Attention mechanisms.
Next, the Foundation Model is fine-tuned using reliable and confirmed data from a Specific Domain (Specific Domain Data). This process creates a model specialized for that particular domain.
Ultimately, this allows the model to provide more reliable responses to users in that specific area. The overall process is summarized by the concept of Retrieval-Augmented Generation.
The image visually represents the components of the RAG model and the flow of data through the system effectively.
From Claude with some prompting This image illustrates a process called “Data Center AI Operation by Humans (Experts).” It depicts the various stages involved in utilizing artificial intelligence (AI) to analyze and optimize data center operations while ensuring that human experts have the final decision-making authority.
The process starts with data collection from various sources like servers and automation systems. This data is then verified and converted into a digital format suitable for analysis by AI algorithms. The AI system performs analysis and generates insights, which are combined with the data center processes to suggest optimizations.
However, before implementing any changes, human experts knowledgeable in data and AI review and finalize all decisions. This approach aims to leverage AI’s analytical capabilities while maintaining human expertise and oversight for critical operational decisions in the data center.
The image emphasizes that while AI acts as an “accelerator” for digitalization and analysis, the ultimate operation is carried out by human experts who understand the nuances of data and AI to ensure effective and responsible decision-making.
From ChatGPT with some prompting Certainly, the image represents the process of collecting data from facilities, demonstrating how different technical components interact.
Facility: This indicates the physical equipment or site generating data, likely composed of various sensors and devices.
Data Relay Device: It serves as an intermediary, relaying data collected from the facility to the network. It is depicted as being connected to the network via an IP address and port number.
TCP/IP Network: The path through which data is transmitted, utilizing the TCP/IP protocol to transfer data. This network manages the flow of data to the data point.
Data Point: The location where collected data is processed, where important metrics such as software protocol and data collection rate are set.
Network Topology: This represents the physical or logical layout of the network, including performance-related metrics such as the specifications of switches.
TCP/IP Layer: Although not explicitly illustrated in the image, the TCP/IP network is intended to be managed as a distinct logical layer. This emphasizes the advantages of managing and optimizing the data transmission process.
The image visually communicates these technical details, providing an overview of how each component is interconnected for the purpose of data collection and transmission.
From ChatGPT with some prompting The image is a schematic representation of GPU applications across three domains, emphasizing the GPU’s strength in parallel processing:
Image Processing: GPUs are employed to perform parallel updates on image data, which is often in matrix form, according to graphical instructions, enabling rapid rendering and display of images.
Blockchain Processing: For blockchain, GPUs accelerate the calculation of new transaction hashes and the summing of existing block hashes. This is crucial in the race of mining, where the goal is to compute new block hashes as efficiently as possible.
Deep Learning Processing: In deep learning, GPUs are used for their ability to process multidimensional data, like tensors, in parallel. This speeds up the complex computations required for neural network training and inference.
A common thread across these applications is the GPU’s ability to handle multidimensional data structures—matrices and tensors—in parallel, significantly speeding up computations compared to sequential processing. This parallelism is what makes GPUs highly effective for a wide range of computationally intensive tasks.
From Copilot with some prompting The image you shared represents a diagram titled “Facility Data Spec.” Here’s the description:
Image Description:
The diagram depicts the process of defining data requirements centered around facility-based data management.
On the left side, there’s an icon representing a “Facility,” which is connected to elements such as data generation rate, hardware interface, and software protocol.
A relay network (symbolized by gears) is linked to the facility and leads to an IP port.
The IP port connects to a TCP/IP network represented by circuit lines, ultimately leading to a data point.
The data point includes elements like data explanations and data units.
At the top right corner of the image, there are URLs and an email address.
Summary:
The diagram illustrates how data is generated within a facility, transmitted through various networks and protocols, and ultimately represented as data points.
This diagram provides valuable insights for managing facility-related data requirements. Understanding and effectively managing data specifications at the facility level is crucial for efficient data management.
From Gemini with some prompting Facility-centric data definition for facility data management Facility data management is the process of systematically collecting, storing, managing, and analyzing data generated from facilities. Facility data includes information on the facility’s condition, operation, and production. Facility data management can lead to the following benefits:
Improved facility efficiency Prediction and prevention of facility failures Increased productivity Energy savings Facility-centric data definition is a data definition approach that centers on facilities. It offers the following benefits:
Data consistency Improved data accessibility Increased data usability The diagram illustrates the following facility-centric data definition requirements for facility data management:
Facility: The facility is the entity that generates data. Different types of facilities exist, and each type generates different data. Data point: A data point is a unit of data generated from a facility. It includes the data name, data type, and data value. Network: The network is a communication network that connects facilities and data points. Data generated from facilities is transmitted to data points through the network. Data repository: The data repository is a place where data is stored. Different types of data repositories exist, and each type has different characteristics. Data processing: Data processing is the process of analyzing and utilizing data. It includes data cleaning, data analysis, and data visualization. Facility-centric data definition requirements for facility data management:
Data consistency: Facility-centric data definition should ensure data consistency. Data names, data types, and data values should be standardized to maintain data consistency. Data accessibility: Facility-centric data definition should improve data accessibility. The data repository should be appropriately selected, and data access permissions should be managed to enhance data accessibility. Data usability: Facility-centric data definition should increase data usability. Data analysis tools should be utilized, and data-driven decision-making should be implemented to improve data usability. Conclusion:
Facility-centric data definition requirements should be considered for facility data management. Facility-centric data definition can enhance data consistency, accessibility, and usability, leading to improved facility efficiency, productivity, and energy efficiency.