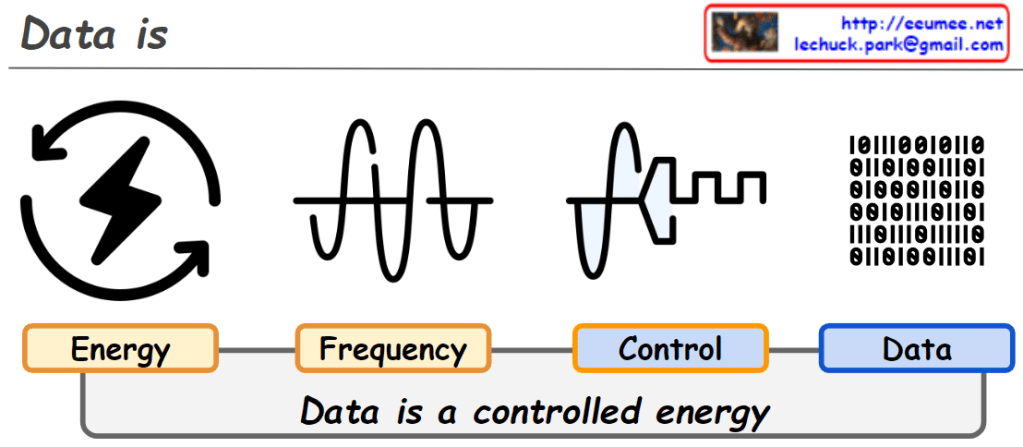
From DALL-E with some prompting The image conveys the concept that data fundamentally stems from energy, which is harnessed and controlled to create meaningful information. It illustrates a progression from an energy symbol to a sine wave representing frequency, followed by a rectangular waveform symbolizing control, culminating in binary code blocks that represent data. The diagram encapsulates the idea that data is a form of controlled energy, systematically transformed to serve our purposes.
From DALL-E with some prompting This image appears to be a conceptual diagram of an individual’s AI agent, divided into several parts:
Personal Area: There’s a user icon with arrows labeled ‘Control’ and ‘Sensing All’. This suggests the user can direct the AI agent and the AI is capable of gathering comprehensive information from its environment.
Micro & Macro Infinite World: This part features illustrations that seem to represent microorganisms, plants, butterflies, etc., indicating that the AI collects data from both microscopic and macroscopic environments.
Personalized Resource: The icon resembling a human brain could represent personalized services or data tailored to the user.
Cloud Infra: The cloud infrastructure is presumably responsible for data processing and storage.
Cloud Service: Depicted as a server providing various services, connected to the cloud infrastructure.
Internet Connected: A globe icon with various network points suggests that the AI agent is connected to global information and knowledge via the internet.
Overall, the diagram illustrates a personalized AI agent that collects information under the user’s control, processes it through cloud infrastructure and services, and ultimately contributes to collective intelligence through an internet connection.
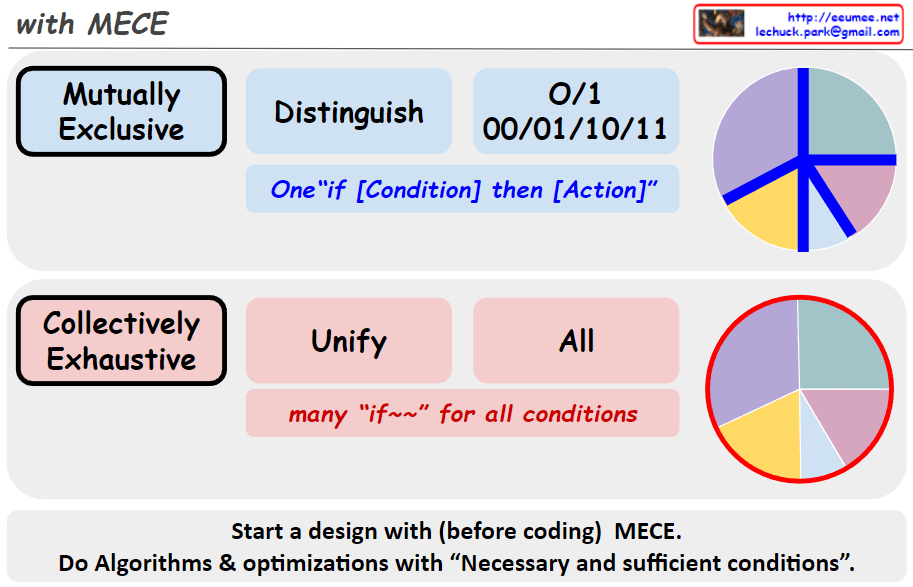
From DALL-E with some prompting The image provides a visual explanation of design and algorithm optimization strategies based on the MECE principle, which stands for “Mutually Exclusive, Collectively Exhaustive.”
In the blue area at the top (“Mutually Exclusive”), there’s content related to “Distinguish,” which signifies conditions that are clearly differentiated from one another. It includes binary code formats “0/1” and “00/01/10/11” as examples, representing distinct states. The pie chart beside it illustrates segments that are clearly separated, denoting distinct categories. Below is the phrase “One ‘if [Condition] then [Action]'”, suggesting that for a specific condition, one action is defined—akin to an “if” statement in programming.
In the pink area at the bottom (“Collectively Exhaustive”), there’s content related to “Unify.” This implies the inclusion of all possibilities by using many “if~” statements for all conditions. The word “All” emphasizes encompassing and including every condition. The circular chart beside it shows various pieces coming together to complete a circle, representing completeness when all parts are combined.
The overall context suggests applying the MECE principle in programming or system design to distinctly separate mutually exclusive conditions (as shown in the top blue area) and to comprehensively address all possible conditions (as indicated in the bottom pink area) to ensure the entire system or program functions comprehensively. The statement “Start a design with (before coding) MECE. Do Algorithms & optimizations with ‘Necessary and sufficient conditions’.” advises to apply the MECE principle when starting a design and to consider necessary and sufficient conditions when working on algorithms and optimizations.
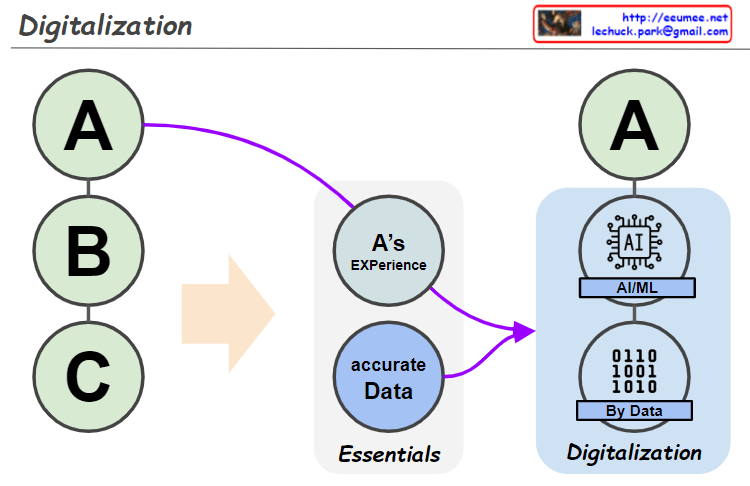
From DALL-E with some prompting The image depicts three levels of experience, A, B, and C, highlighting that while A represents a high level of experience, levels B and C can be enhanced through digital transformation using data and AI technologies. This transformation underscores that the collection and analysis of accurate data are essential elements, as they lay the foundation for AI systems to perform sophisticated learning, thus improving operational efficiency and precision.
The integration of individual experiences and precise data is not merely a technical shift but also prompts significant changes in human resource management within organizations. By incorporating their expertise into digital platforms, employees can strengthen the organization’s knowledge base and contribute to their own professional development.
Ultimately, this digital transformation should be sustainable and maintain a human-centric approach, ensuring that the increase in operational efficiency through AI alleviates the workload on employees, fostering creativity and enhancing the organizational culture and values.
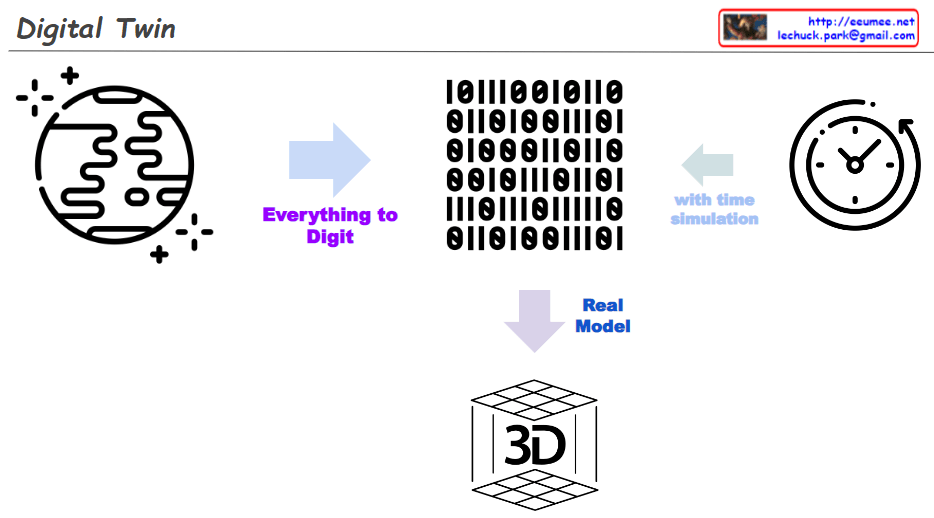
From DALL-E with some prompting This image depicts a conceptual diagram for a “Digital Twin.”
In the top left, there’s an icon representing a physical object, resembling the Earth with dots and lines, indicating complexity and connectivity.
A rightward arrow from the object leads to a phrase “Everything to Digit,” suggesting the transformation of a physical object into digital data.
The top right block is filled with binary codes, representing digital information.
Next to this block, there’s an icon of a clock with the phrase “with time simulation,” indicating the process includes temporal changes or predictions over time.
An arrow points downward to the phrase “Real Model,” signifying the creation of a practical model from the digital information and simulations.
At the bottom, there’s a 3D cube labeled “3D,” symbolizing the digital twin’s realization as a three-dimensional model.
A digital twin is a virtual replica of a physical object or system, bridging the physical and digital worlds. It can be used for real-time analytics, system monitoring, troubleshooting, and predictive maintenance. The diagram visually represents the process of creating a digital twin, omitting personal or organizational contact information that is present in the image.
From DALL-E with some prompting The flowchart illustrates a four-step network anomaly detection process:
Data Collection: Gather various types of network data.
Protocol Usage: Employ SNMP, SFLOW/NETFLOW, and other methods to extract the data.
Analysis: Analyze Ethernet and TCP/IP header data for irregularities.
Control: Implement countermeasures like blocking traffic or controlling specific IP addresses.
The expected benefits of this process include enhanced network security through early detection of anomalies, the ability to prevent potential breaches by blocking suspicious traffic, and improved network management via real-time analysis and control.
Linear Regression: Yields a continuous output. Relates independent variable X with dependent variable Y through a linear relationship. Uses Mean Squared Error (MSE) as a performance metric. Can be extended to Multi-linear Regression for multiple independent variables.
Linear & Logistic Regression
The process begins with data input, as indicated by “from Data.”
Machine learning algorithms then process this data.
The outcome of this process branches into two types of regression, as indicated by “get Functions.”
Logistics Regression: Used for classification tasks, distinguishing between two or more categories. Outputs a probability percentage (between 0 or 1) indicating the likelihood of belonging to a particular class. Performance is evaluated using Log Loss or Binary Cross-Entropy metrics. Can be generalized to Softmax/Multinomial Logistic Regression for multi-class classification problems.
The image also graphically differentiates the two types of regression. Linear Regression is represented with a scatter plot and a trend line indicating the predictive linear equation. Logistic Regression is shown with a sigmoid function curve that distinguishes between two classes, highlighting the model’s ability to classify data points based on the probability threshold.