Down data

From Claude with some prompting
I can interpret the contents of this image as follows:

  1. Sampling is a method to reduce the “Down Count”, i.e., the number of data points, by extracting only a subset of the entire data.
  2. Roll Up is a method to reduce the “Down Count” by aggregating data over time units. The aggregation functions (Count, Sum, Avg, Max, Min, etc.) are included as examples to help understand the concept of Roll Up.
  3. Quantization is a method to reduce the data size (“Down Size”) by converting floating-point numbers to nearby integers.
  4. “And More…” mentions additional data reduction techniques like Sparse Data Encoding, Feature Selection, and Dimensionality Reduction.

Overall, the image effectively explains how Sampling and Roll Up reduce the number of data points (“Down Count”), while Quantization reduces the data size (“Down Size”).

Data

From Claude with some prompting
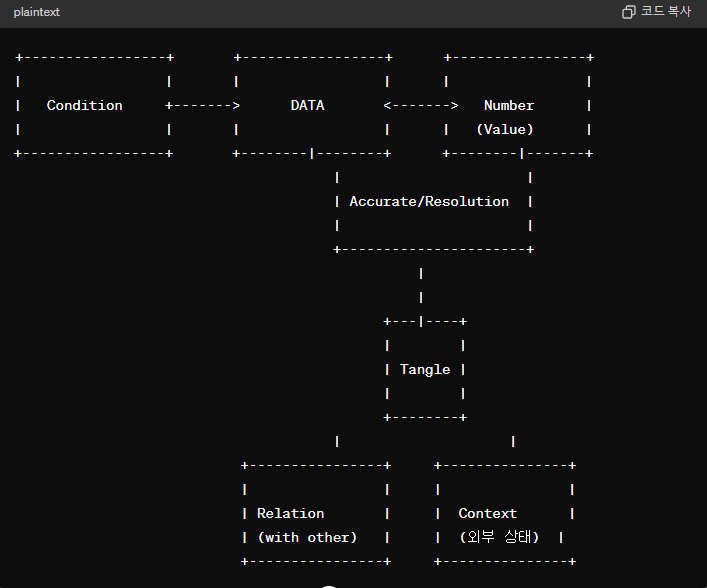
This image presents a comprehensive definition of data that goes beyond just numerical values. To clearly understand data, several elements must be considered.

First, the accuracy and resolution of the data itself are crucial. The “Number (Value)” represents numerical values that must be precise and have an appropriate level of resolution.

Second, data is closely related to external factors. “Condition” indicates a relationship with the state or condition of other data, while “Relation with other” suggests interconnectedness with other data sets.

Third, “Tangle” illustrates that data is not merely a simple number but is complexly intertwined with various elements. To clearly define data, these intricate interconnections and interdependencies must be accounted for.

In essence, the image presents a definition of data that encompasses accuracy, resolution, relationships with external conditions, and intricate interconnectedness. It emphasizes that to truly grasp the nature of data, one must comprehensively consider all these aspects.

The image underscores that data cannot be reduced to just numeric values; rather, it is a multifaceted concept intricately tied to precision, granularity, external factors, and interdependent relationships. Fully understanding data requires a holistic examination of all these interlinked elements.

Updated by GPT-4o

The Limitation of the AI

From Claude with some prompting
This image illustrates the process of creating a “human-like AI” through the stages of “Big Data -> Learning -> Good AI.”

The first stage is “Big Data,” which serves as the foundation for AI training. It requires collecting vast amounts of accurate and reliable data from various sources.

The second stage is “Learning,” where the big data is fed into deep learning algorithms and neural network models for training. This process requires immense computing power and optimized AI models.

The third stage yields a “Good AI” capable of tasks like data classification and processing as a result of the learning process.

However, the image suggests that the goal goes beyond creating an AI with “Many Numbers” and “Classification” abilities. The ultimate aim is to develop an AI that reaches “Human-Like” levels of intelligence and capability.

Crucially, the entire process is underpinned by the availability of “Accurate & Reliable DATA.” No matter how advanced the algorithms and computing power, if the data itself lacks quality and trustworthiness, achieving a truly “Human-Like AI” will be extremely challenging.

Therefore, the key message conveyed by this image is that the quality and reliability of data will be the critical factor determining the competitiveness of AI systems in the future. Securing accurate and trustworthy data is emphasized as the fundamental requirement for realizing human-level artificial intelligence.

DC Data Collecting Performance Factors

From Claude with some prompting
This image conceptually illustrates various factors that can affect the performance of DC data collection. The main components include the facility generating the data, the facility network, PLC/DDC converters, an integration network, and the final collection/analysis system.

Factors that can impact data collection performance include the data generation rate, CPU performance, bandwidth limitations of the network medium, network topology, protocols used (such as TCP/IP and SNMP), input/output processing performance, and program logic.

The diagram systematically outlines the overall flow of the DC data collection process and the performance considerations at each stage. It covers elements like the facility, network infrastructure, data conversion, integration, and final collection/analysis.

By mapping out these components and potential bottlenecks, the image can aid in the design and optimization of data collection systems. It provides a comprehensive overview of the elements that need to be accounted for to ensure efficient data gathering performance.


MaKING “1”

From Claude with some prompting
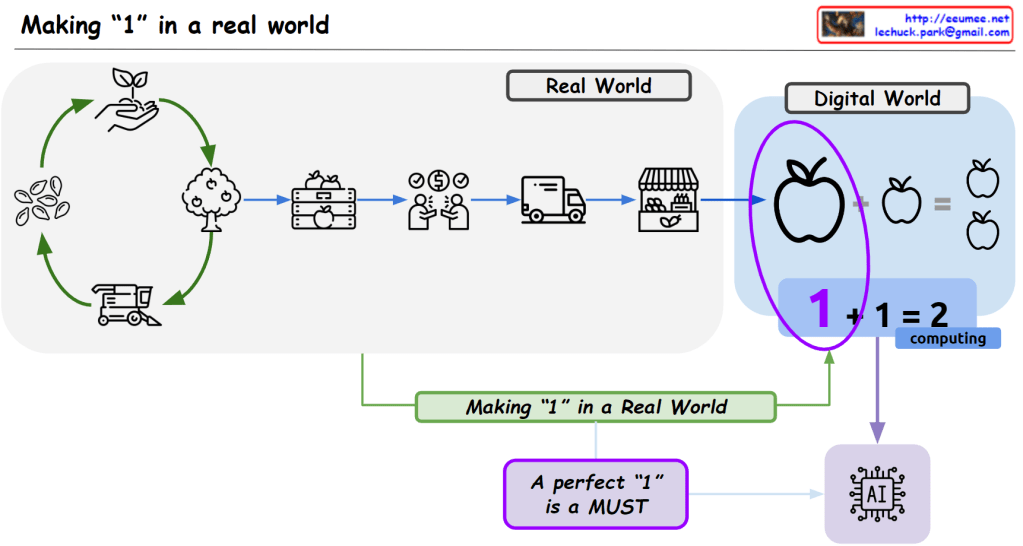
This image emphasizes the crucial importance of obtaining high-quality data from the real world for the advancement of the digital world, particularly artificial intelligence (AI).

The real-world section depicts the complex series of steps required to produce a “perfect 1,” or a product of excellent quality (e.g., an apple), including growing trees, harvesting, transportation, and selling.

In contrast, the digital world represents this intricate process through a simple mathematical computation (1 + 1 = 2). However, the image conveys that securing flawless data from the real world is an extremely important and arduous process for AI to develop and improve.

In essence, the image highlights that the complex process of extracting high-quality data from the physical realm is essential for enhancing AI performance. It serves as a reminder that this crucial aspect should not be overlooked or underestimated.

The overall message is that for AI to advance in the digital world, obtaining pristine data from the real world through an intricate series of steps is an indispensable and challenging requirement that must be prioritized.

Data Quality

From Claude with some prompting
This image is an infographic explaining the concept of data quality. It shows the flow of data from a facility or source, going through various stages of power consumption like generating, medium, converting, network, and computing power. The goal is to ensure reliable data with good performance and high resolution for optimal analysis and better insights represented by icons and graphs.

The key aspects highlighted are:

  1. Data origin at a facility
  2. Different power requirements at each data stage (generating, medium, converting, network, computing)
  3. Desired qualities of reliable data, good performance, high resolution
  4. End goal of collecting/analyzing data for better insights

The infographic uses a combination of text labels, icons, and diagrams to illustrate the data quality journey from source to valuable analytical output in a visually appealing manner.

New infra age

From Claude with some prompting
This image illustrates the surge in data and the advancement of AI technologies, particularly parallel processing techniques that efficiently handle massive amounts of data. As a result, there is a growing need for infrastructure technologies that can support such data processing capabilities. Technologies like big data processing, parallel processing, direct memory access, and GPU computing have evolved to meet this demand. The overall flow depicts the data explosion, the advancement of AI and parallel processing techniques, and the evolution of supporting infrastructure technologies.