Planning
The Computing for the Fair Human Life.
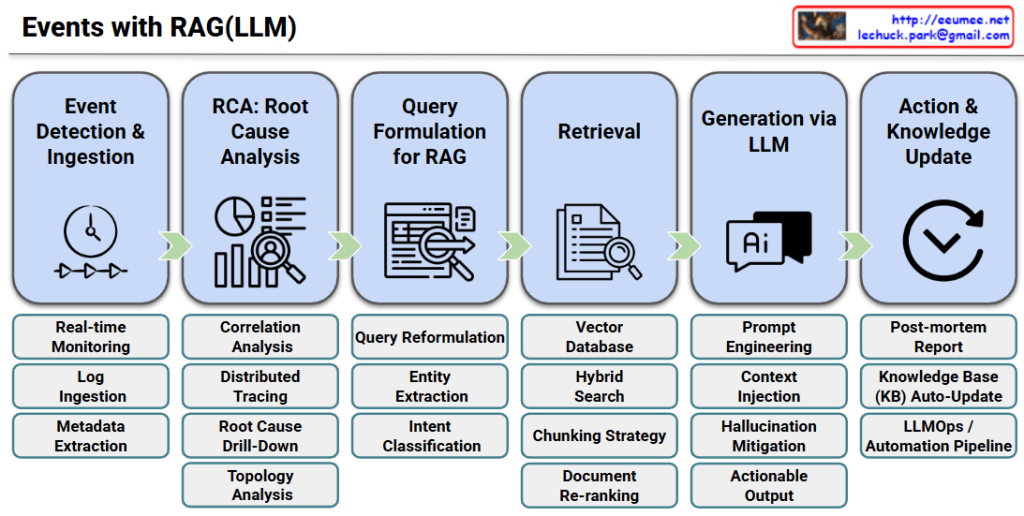
Step 1: Event Detection & Ingestion
This initial stage focuses on capturing system anomalies through real-time monitoring, collecting necessary logs, and extracting essential metadata to understand the context of the event.
Step 2: RCA: Root Cause Analysis
It identifies the fundamental issue behind the surface-level symptoms by utilizing correlation analysis, distributed tracing, root cause drill-down, and infrastructure topology analysis.
Step 3: Query Formulation for RAG
The system translates the RCA findings into an optimized search prompt through query reformulation, entity extraction, and intent classification to fetch the most accurate solutions.
Step 4: Retrieval
It searches for the most relevant technical documents or past incident records from a Vector Database, leveraging hybrid search, chunking strategies, and document re-ranking techniques.
Step 5: Generation via LLM
The LLM generates an actionable troubleshooting guide by combining prompt engineering and context injection, strictly mitigating any AI hallucinations.
Step 6: Action & Knowledge Update
Finally, after the issue is resolved, the system automatically updates its knowledge base with post-mortem reports, ensuring a continuous feedback loop through an automated LLMOps pipeline.
#AIOps #RAG_Architecture #RootCauseAnalysis #LLMOps #IncidentManagement #TroubleshootingAutomation #VectorDatabase
With Gemini
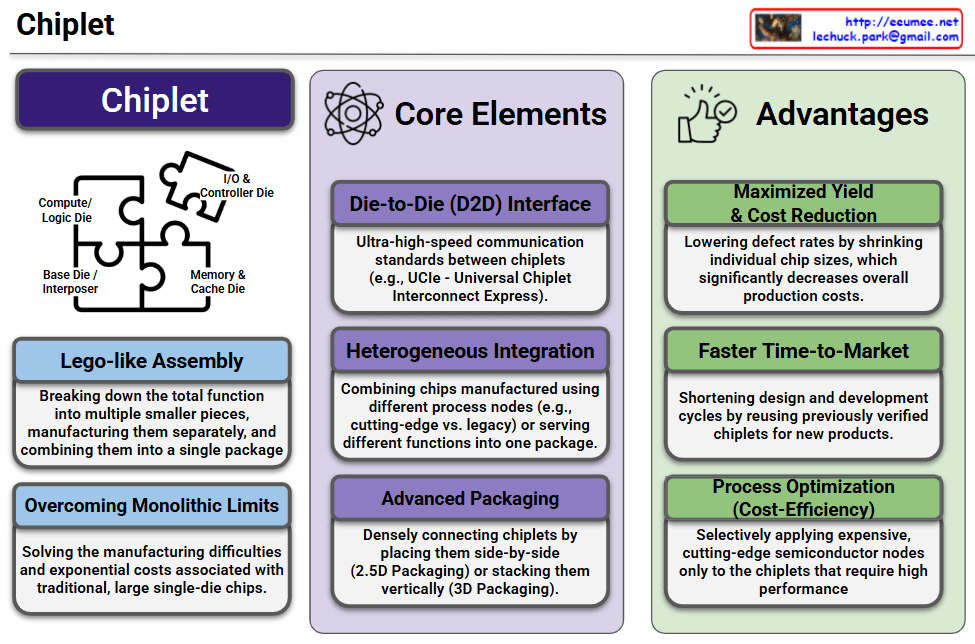
This infographic provides a highly structured and clear overview of Chiplet technology, dividing the subject into its core concept, essential technological elements, and primary business advantages.
This section highlights the three foundational technologies required to make chiplets function seamlessly:
The rightmost column outlines the strategic and financial benefits of adopting the chiplet architecture:
Chiplet technology represents a critical paradigm shift in semiconductor manufacturing. By transitioning from monolithic designs to a modular, “lego-like” assembly—enabled by advanced packaging, heterogeneous integration, and high-speed D2D interfaces—the industry can overcome physical scaling limits. This architecture not only slashes manufacturing costs and improves yield but also accelerates innovation, making it the foundational technology driving today’s high-performance AI accelerators and advanced data center operations.
#Chiplet #Semiconductor #AdvancedPackaging #HeterogeneousIntegration #UCIe #AIChips #HighPerformanceComputing #HPC #TechInfographic #TechInnovation
With Gemini

The left side outlines the fundamental building blocks of a DPU, detailing how tasks are distributed across its hardware:
The right side highlights how these hardware components translate into tangible infrastructure benefits:
This infographic perfectly illustrates how DPUs transform server architectures by offloading critical network, storage, and security tasks to specialized hardware. By isolating infrastructure management from core compute resources, DPUs maximize overall efficiency, making them an indispensable foundation for a high-performance AI Data Center Integrated Operations Platform.
#DPU #DataProcessingUnit #NetworkOffloading #SmartNIC #FPGA #ZeroTrust #CloudInfrastructure
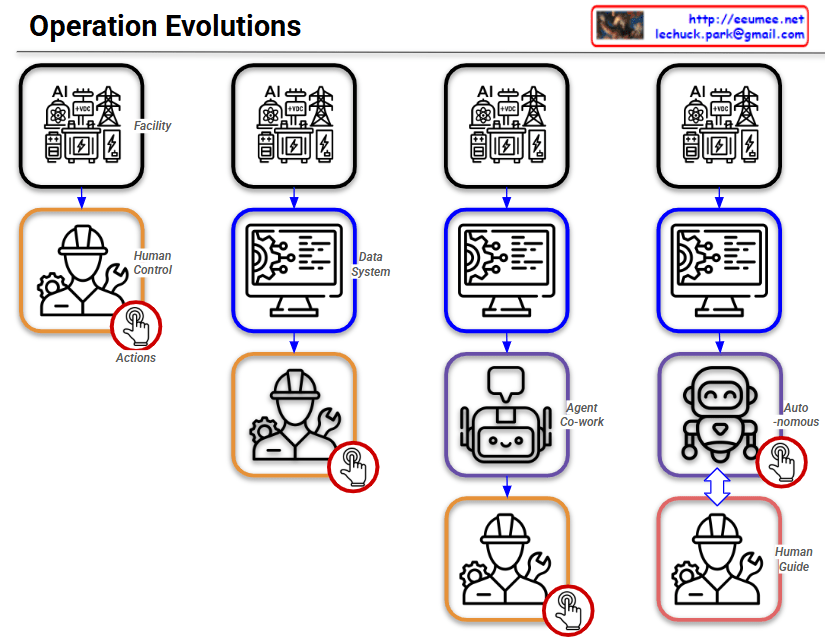
By following the red circle with the ‘Actions’ (clicking hand) icon, you can easily track how the control and operational authority shift throughout the four stages.
Summary:
This slide intuitively illustrates a paradigm shift in infrastructure operations: progressing from Direct Human Intervention ➡️ System-Assisted Cognition ➡️ AI-Assisted Operations (Co-work) ➡️ Fully Autonomous AI Control with Human Supervision.
#AIOps #AutonomousOperations #TechEvolution #DigitalTransformation #DataCenter #FacilityManagement #InfrastructureAutomation #SmartFacilities #AIAgents #FutureOfWork #HumanAndAI #Automation
with Gemini
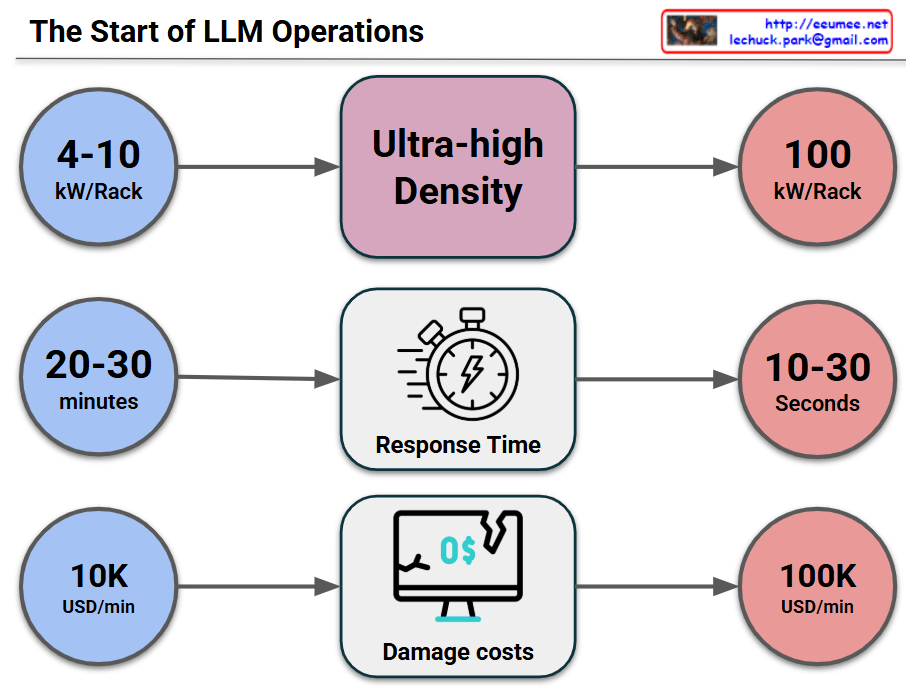
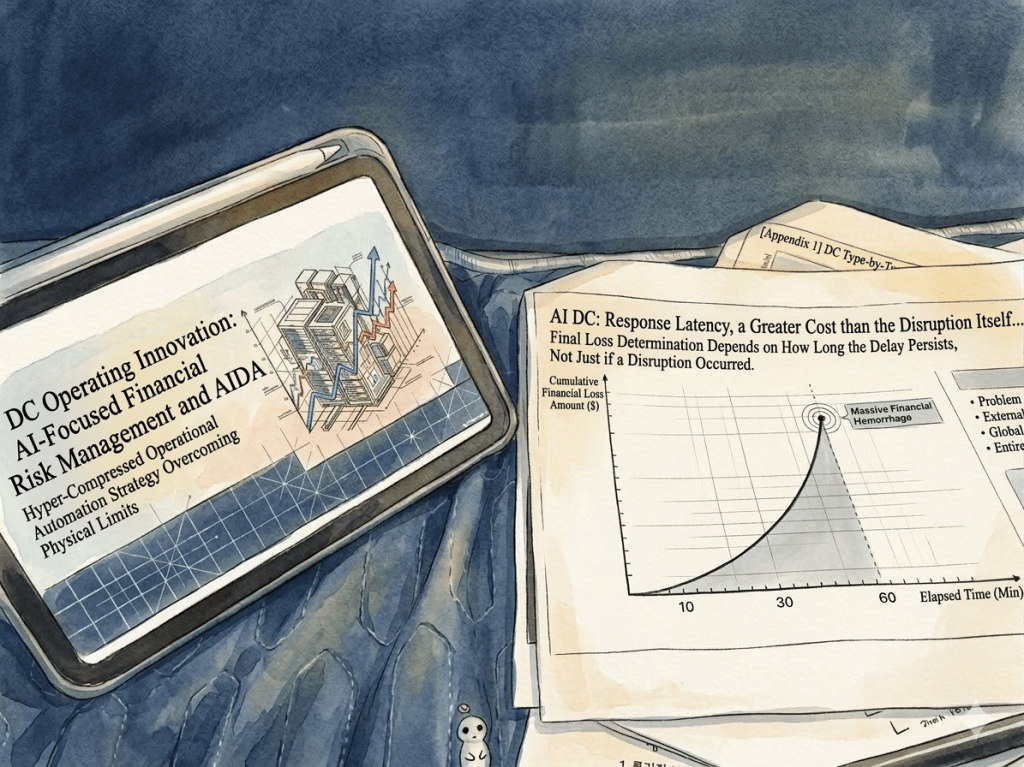
This image visually compares the critical changes and risks that occur when a data center or IT infrastructure transitions to an “Ultra-high Density” environment across three key metrics.
1. Surge in Power Density (Top Row)
2. Drastic Drop in Response Time (Middle Row)
3. Explosion of Damage Costs (Bottom Row)
The core message of this infographic is a strong warning: “In ultra-high density environments reaching 100kW per rack, the window for disaster response shrinks from minutes to mere seconds, while the financial loss per minute multiplies tenfold.” This perfectly illustrates why immediate, automated cooling and response systems (such as liquid cooling or AI-driven automation) are no longer optional, but mandatory for modern data centers.
#DataCenter#UltraHighDensity#HighDensityComputing#ITInfrastructure#Downtime#CostOfDowntime#RiskManagement
With Gemini