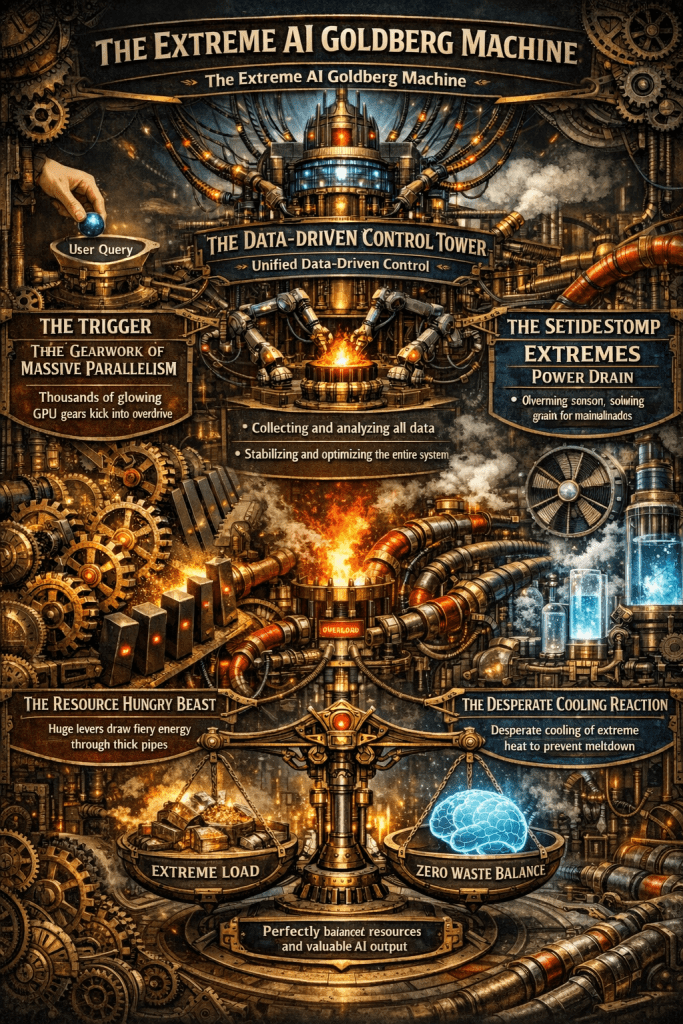
A single AI response triggers a massive chain reaction of compute, power, and cooling.
Only unified, data-driven control can stabilize this fragile system and eliminate waste.
The Computing for the Fair Human Life.
A single AI response triggers a massive chain reaction of compute, power, and cooling.
Only unified, data-driven control can stabilize this fragile system and eliminate waste.

This image illustrates the dramatic growth in computing performance and data throughput from the Internet era to the AI/LLM era.
1. Internet Era
2. Mobile & Cloud Era
3. AI/LLM (Transformer) Era – “Now Here?” point
The chart demonstrates unprecedented exponential growth in data processing and power consumption driven by AI and Large Language Models. While data center efficiency (PUE) has improved significantly, the sheer scale of computational demands has skyrocketed. This visualization emphasizes the massive infrastructure requirements that modern AI systems necessitate.
#AI #LLM #DataCenter #CloudComputing #MachineLearning #ArtificialIntelligence #BigData #Transformer #DeepLearning #AIInfrastructure #TechTrends #DigitalTransformation #ComputingPower #DataProcessing #EnergyEfficiency

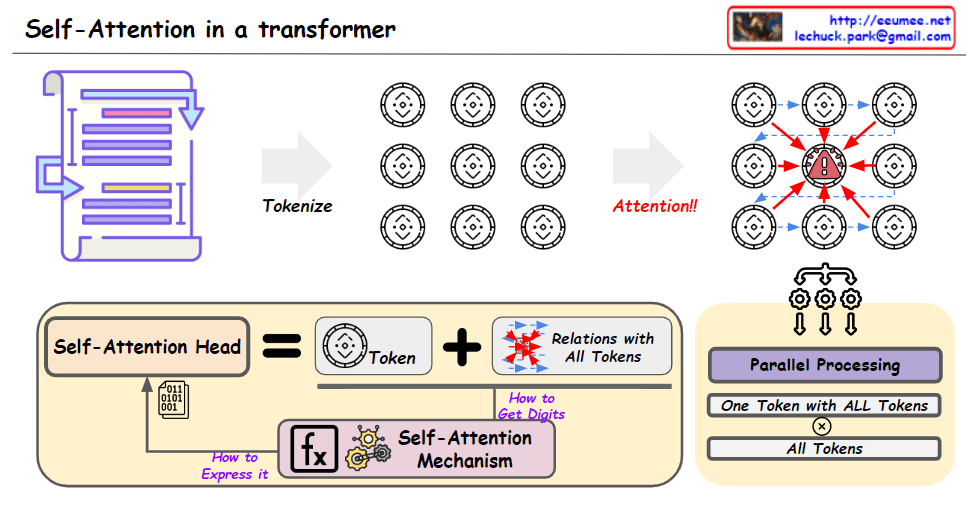
Visual Analysis: RNN vs Transformer
The diagram succeeds by using:
The grid vs chain visualization immediately conveys why Transformers enable faster, more scalable processing than RNNs.
This diagram effectively illustrates the fundamental shift from sequential to parallel processing in neural architecture. The visual contrast between RNN’s linear chain and Transformer’s interconnected grid clearly demonstrates why Transformers revolutionized AI by enabling massive parallelization and better long-range dependencies.
With Claude
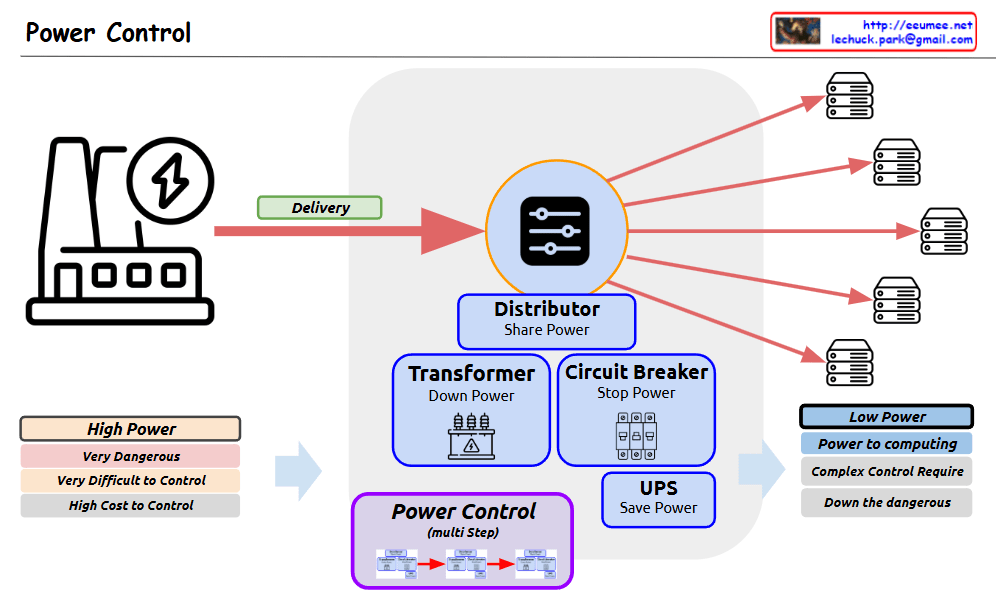
Power Control system diagram
The diagram shows the complete process of how high-power electricity is safely and efficiently controlled and converted into low-power suitable for computing systems. The power flow is illustrated through a “Delivery” phase, passing through various protective and control devices before being distributed to multiple servers or computing equipment.
The system emphasizes safety and control through multiple stages:
This setup ensures safe and reliable power distribution while reducing the risks associated with high-power electrical systems.
With Claude
From Claude with some prompting
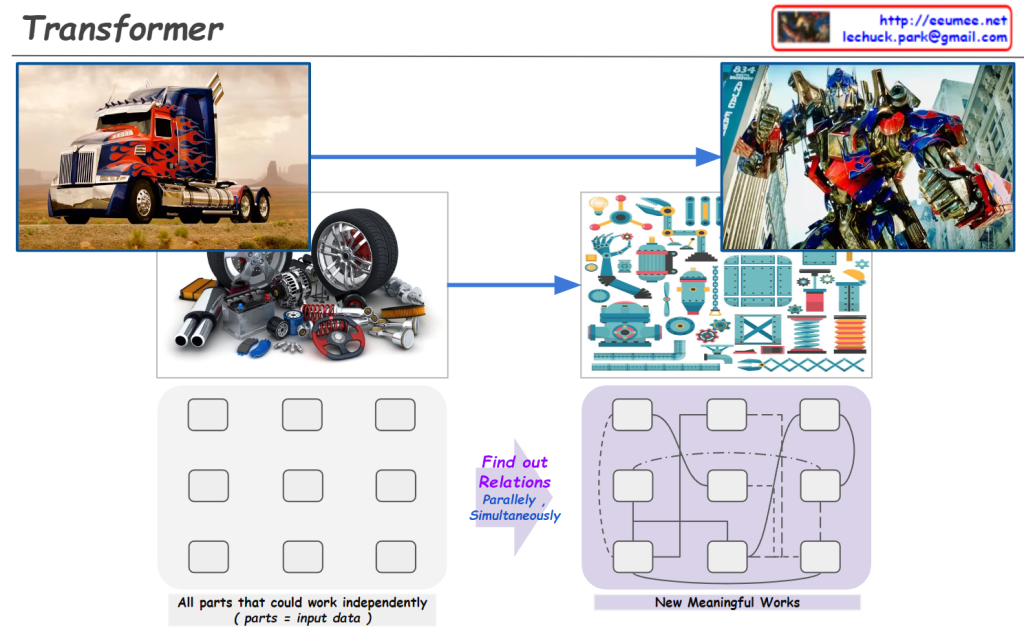
The image is using an analogy of transforming vehicles to explain the concept of the Transformer architecture in AI language models like myself.
Just like how a vehicle can transform into a robot by having its individual components work in parallel, a Transformer model breaks down the input data (e.g. text) into individual elements (tokens/words). These elements then go through a series of self-attention and feed-forward layers, processing the relationships between all elements simultaneously and in parallel.
This allows the model to capture long-range dependencies and derive contextual meanings, eventually transforming the input into a meaningful representation (e.g. understanding text, generating language). The bottom diagram illustrates this parallel and interconnected nature of processing in Transformers.
So in essence, the image draws a clever analogy between transforming vehicles and how Transformer models process and “transform” input data into contextualized representations through its parallelized and self-attentive computations.