NVLink, Infiniband

This diagram compares two GPU networking technologies: NVLink and InfiniBand, both essential for parallel computing expansion.

On the left side, the “NVLink” section shows multiple GPUs connected vertically through purple interconnect bars. This represents the “Scale UP” approach, where GPUs are vertically scaled within a single system for tight integration.

On the right side, the “InfiniBand” section demonstrates how multiple server nodes connect through an InfiniBand network. This illustrates the “Scale Out” approach, where computing power expands horizontally across multiple independent systems.

Both technologies share the common goal of expanding parallel processing capabilities, but they do so in different architectural approaches. NVLink focuses on high-speed, direct connections between GPUs in a single system, while InfiniBand specializes in networking across multiple systems to support distributed computing environments.

The optimization of these expansion configurations is crucial for maximizing performance in high-performance computing, AI training, and other compute-intensive applications. System architects must carefully consider workload characteristics, data movement patterns, and scaling requirements when choosing between these technologies or determining how to best implement them together in hybrid configurations.

With Claude
Connected in AI DC

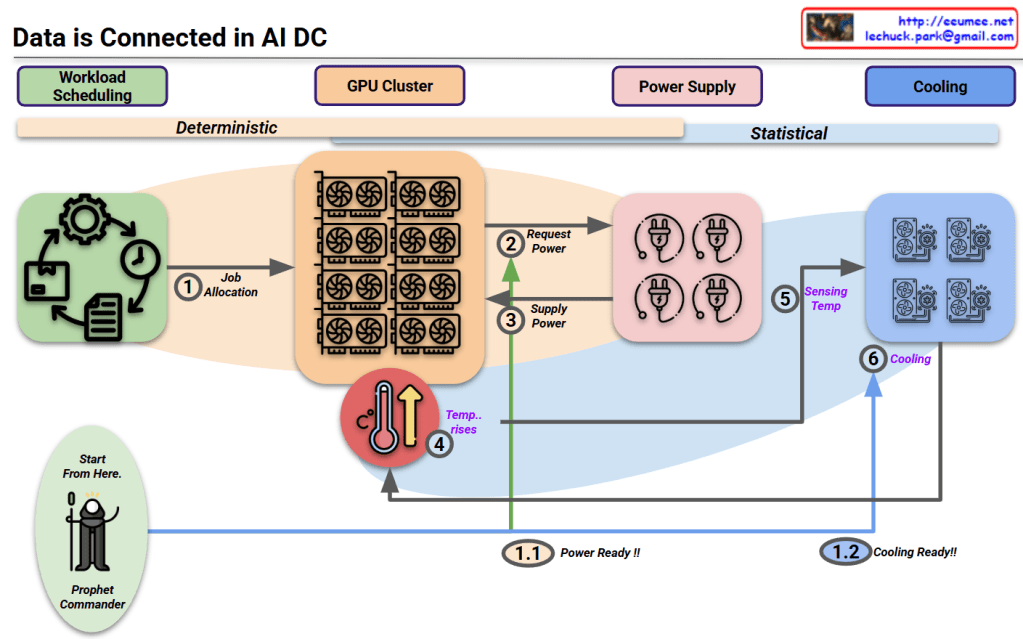
This diagram titled “Data is Connected in AI DC” illustrates the relationships starting from workload scheduling in an AI data center.

Key aspects of the diagram:

  1. The entire system’s interconnected relationships begin with workload scheduling.
  2. The diagram divides the process into two major phases:
    • Deterministic phase: Primarily concerned with power requirements that operate in a predictable, planned manner.
    • Statistical phase: Focused on cooling requirements, where predictions vary based on external environmental conditions.
  3. The “Prophet Commander” at the workload scheduling stage can predict/direct future requirements, allowing the system to prepare power (1.1 Power Ready!!) and cooling (1.2 Cooling Ready!!) in advance.
  4. Process flow:
    • Job allocation from workload scheduling to GPU cluster
    • GPUs request and receive power
    • Temperature rises due to operations
    • Cooling system detects temperature and activates cooling

This diagram illustrates the interconnected workflow in AI data centers, beginning with workload scheduling that enables predictive resource management. The process flows from deterministic power requirements to statistical cooling needs, with the “Prophet Commander” enabling proactive preparation of power and cooling resources. This integrated approach demonstrates how workload prediction can drive efficient resource allocation throughout the entire AI data center ecosystem.

With Claude

Analytical vs Empirical

Analytical vs Empirical Approaches

Analytical Approach

  1. Theory Driven: Based on mathematical theories and logical reasoning
  2. Programmable with Design: Implemented through explicit rules and algorithms
  3. Sequential by CPU: Tasks are processed one at a time in sequence
  4. Precise & Explainable: Results are accurate and decision-making processes are transparent

Empirical Approach

  1. Data Driven: Based on real data and observations
  2. Deep Learning with Learn: Neural networks automatically learn from data
  3. Parallel by GPU: Multiple tasks are processed simultaneously for improved efficiency
  4. Approximate & Unexplainable: Results are approximations and internal workings are difficult to explain

Summary

This diagram illustrates the key differences between traditional programming methods and modern machine learning approaches. The analytical approach follows clearly defined rules designed by humans and can precisely explain results, while the empirical approach learns patterns from data and improves efficiency through parallel processing but leaves decision-making processes as a black box.

with claude

GPU vs NPU on Deep learning

This diagram illustrates the differences between GPU and NPU from a deep learning perspective:

GPU (Graphic Process Unit):

  • Originally developed for 3D game rendering
  • In deep learning, it’s utilized for parallel processing of vast amounts of data through complex calculations during the training process
  • Characterized by “More Computing = Bigger Memory = More Power,” requiring high computing power
  • Processes big data and vectorizes information using the “Everything to Vector” approach
  • Stores learning results in Vector Databases for future use

NPU (Neuron Process Unit):

  • Retrieves information from already trained Vector DBs or foundation models to generate answers to questions
  • This process is called “Inference”
  • While the training phase processes all data in parallel, the inference phase only searches/infers content related to specific questions to formulate answers
  • Performs parallel processing similar to how neurons function

In conclusion, GPUs are responsible for processing enormous amounts of data and storing learning results in vector form, while NPUs specialize in the inference process of generating actual answers to questions based on this stored information. This relationship can be summarized as “training creates and stores vast amounts of data, while inference utilizes this at the point of need.”

With Claude

AI in the data center

AI in the Data Center

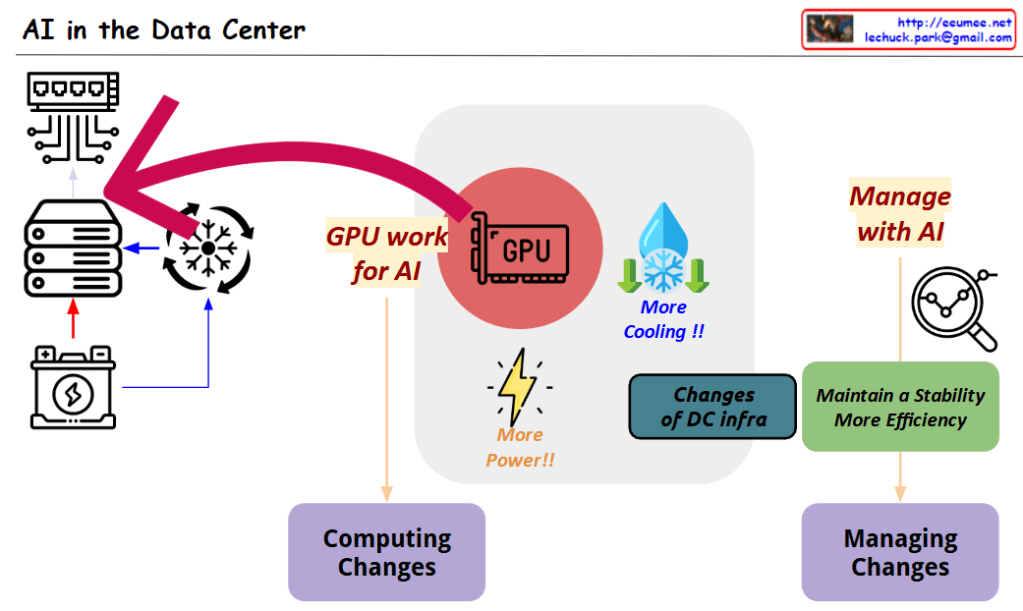
This diagram titled “AI in the Data Center” illustrates two key transformational elements that occur when AI technology is integrated into data centers:

1. Computing Infrastructure Changes

  • AI workloads powered by GPUs become central to operations
  • Transition from traditional server infrastructure to GPU-centric computing architecture
  • Fundamental changes in data center hardware configuration and network connectivity

2. Management Infrastructure Changes

  • Increased requirements for power (“More Power!!”) and cooling (“More Cooling!!”) to support GPU infrastructure
  • Implementation of data-driven management systems utilizing AI technology
  • AI-based analytics and management for maintaining stability and improving efficiency

These two changes are interconnected, visually demonstrating how AI technology not only revolutionizes the computing capabilities of data centers but also necessitates innovation in management approaches to effectively operate these advanced systems.

with Claude

DLSS

DLSS is a graphics processing technology that consists of several key steps:

  1. Initial 3D Data
  • The process begins with 3D model/data input
  1. Rendering Process
  • Uses GPU to render 3D data into 2D screen output
  • Notes that higher resolution rendering requires more computing power
  1. Low Resolution Stage
  • Initially processes images at a lower resolution
  • This helps conserve computing resources
  1. DLSS Processing
  • Utilizes AI models and specialized hardware
  • Employs deep learning technology to enhance image quality
  • Combines lower computing requirements with AI processing
  1. Final Output
  • Upscales the low resolution image to appear high resolution
  • Delivers high-quality visual output that looks like native high resolution

The key advantage of DLSS is its ability to produce high-quality graphics while using less computing power. This technology is particularly valuable in applications requiring real-time rendering, such as gaming, where it can maintain visual quality while improving performance.

This innovative approach effectively balances the trade-off between visual quality and computational resources, making high-quality graphics more accessible on a wider range of hardware.

With Claude

What is The Next?

With Claude
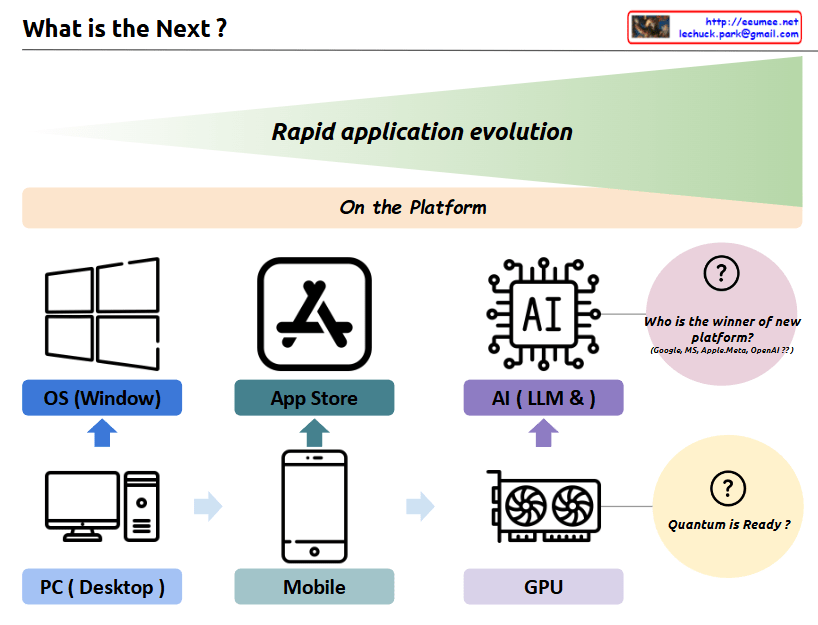
a comprehensive interpretation of the image and its concept of “Rapid application evolution”:

The diagram illustrates the parallel evolution of both hardware infrastructure and software platforms, which has driven rapid application development and user experiences:

  1. Hardware Infrastructure Evolution:
  • PC/Desktop → Mobile Devices → GPU
  • Represents the progression of core computing power platforms
  • Each transition brought fundamental changes in how users interact with technology
  1. Software Platform Evolution:
  • Windows OS → App Store → AI/LLM
  • Shows the evolution of application ecosystems
  • Each platform created new possibilities for user applications

The symbiotic relationship between these two axes:

  • PC Era: Integration of PC hardware with Windows OS
  • Mobile Era: Combination of mobile devices with app store ecosystems
  • AI Era: Marriage of GPU infrastructure with LLM/AI platforms

Each transition has led to exponential growth in application capabilities and user experiences, with hardware and software platforms developing in parallel and reinforcing each other.

Future Outlook:

  1. “Who is the winner of new platform?”
  • Current competition between Google, MS, Apple/Meta, OpenAI
  • Platform leadership in the AI era remains undecided
  • Possibility for new players to emerge
  1. “Quantum is Ready?”
  • Suggests quantum computing as the next potential hardware revolution
  • Implies the possibility of new software platforms emerging to leverage quantum capabilities
  • Continues the pattern of hardware-software co-evolution

This cyclical pattern of hardware-software evolution suggests that we’ll continue to see new infrastructure innovations driving platform development, and vice versa. Each cycle has dramatically expanded the possibilities for applications and user experiences, and this trend is likely to continue with future technological breakthroughs.

The key insight is that major technological leaps happen when both hardware infrastructure and software platforms evolve together, creating new opportunities for application development and user experiences that weren’t previously possible.