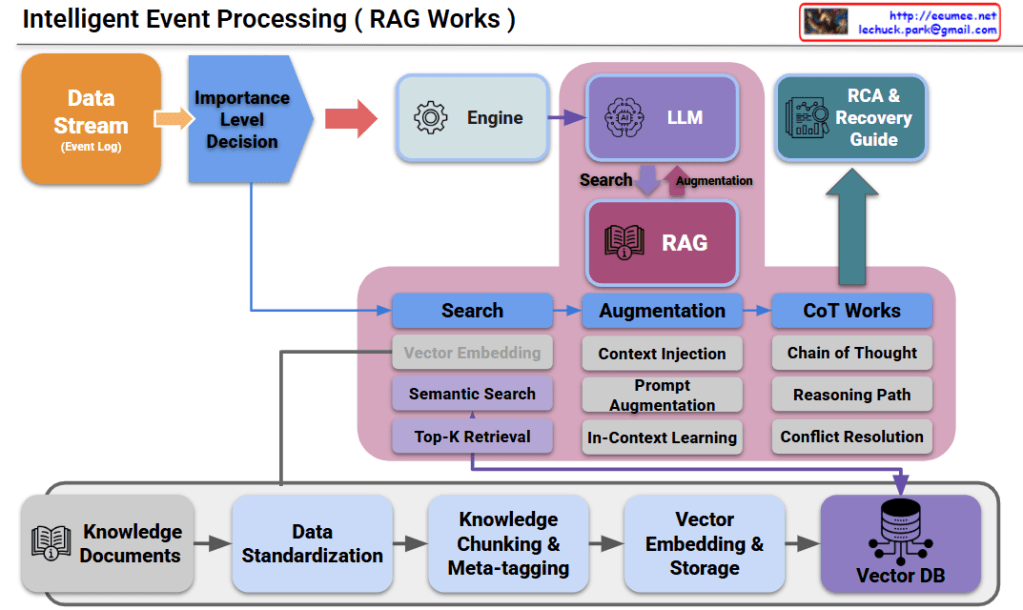
Predictive Count/Resolve Time for .


the “Predictive Count/Resolve Time” Diagram

This diagram illustrates the workflow of IT Operations or System Maintenance, specifically comparing Predictive Maintenance (Proactive) versus Recovery/Reactive (Reactive) processes.

It is divided into two main flows: the Preventive Flow (Left) and the Reactive Flow (Right).

1. Left Flow: Predictive Maintenance

This represents the ideal process where anomalies are detected and addressed before a full system failure occurs.

  • Process:
    • Work Changes / Monitoring: Routine operations and continuous system monitoring.
    • Anomaly: The system exhibits abnormal patterns, but it hasn’t failed yet.
    • Detection (Awareness): Monitoring tools or operators detect this anomaly.
    • Predictive Maintenance: Maintenance is performed proactively to prevent the fault.
  • Key Performance Indicators (KPIs):
    • Count: The number of times predictive maintenance was performed.
    • PTM Success Rate: A metric to measure success (e.g., considered successful if no disability/failure occurs within 14 days after the predictive maintenance).

2. Right Flow: Reactive Recovery

This is the response process when an anomaly is missed, leading to an actual system failure.

  • Process:
    • Abnormal โ†’ Alert: The condition worsens, triggering an alert. The time taken to reach this point is MTTD (Mean Time To Detect).
    • Fault Down: The system actually fails or goes down.
    • Propagation Time (to Experts): The time it takes to escalate the issue to the right experts. This relates to MTTE (Mean Time To Engage Expert).
    • Recovery Time: The time taken by experts to fix the issue.
  • Key Performance Indicators (KPIs):
    • MTTR (Mean Time To Resolve/Repair): The total time from the failure (Fault Down) until the system is fully recovered. Reducing this time is a critical operational goal.

3. Summary & Key Takeaway

The diagram visually emphasizes the importance of “preventing issues before they happen (Left)” rather than “fixing them after they break (Right).”

  • Flow Logic: If an ‘Anomaly’ is successfully ‘Detected’, it leads to ‘Predictive Maintenance’. If missed, it escalates to ‘Abnormal’ and results in a ‘Fault Down’.
  • Goal: The objective is to minimize MTTR (downtime) on the right side and increase the PTM Count (proactive prevention) on the left side to ensure high system availability.

#DevOps #SRE #PredictiveMaintenance #MTTR #IncidentManagement #ITOperations #SystemMonitoring #DisasterRecovery #MTTD #TechMaintenance

With Gemini

Ready For AI DC


Ready for AI DC

This slide illustrates the “Preparation and Operation Strategy for AI Data Centers (AI DC).”

In the era of Generative AI and Large Language Models (LLM), it outlines the drastic changes data centers face and proposes a specific three-stage operation strategy (Digitization, Solutions, Operations) to address them.

1. Left Side: AI “Extreme” Changes

Core Theme: AI Data Center for Generative AI & LLM

  • High Cost, High Risk:
    • Establishing and operating AI DCs involves immense costs due to expensive infrastructure like GPU servers.
    • It entails high power consumption and system complexity, leading to significant risks in case of failure.
  • New Techs for AI:
    • Unlike traditional centers, new power and cooling technologies (e.g., high-density racks, immersion cooling) and high-performance computing architectures are essential.

2. Right Side: AI Operation Strategy

Three solutions to overcome the “High Cost, High Risk, and New Tech” environment.

A. Digitization (Securing Data)

  • High Precision, High Resolution: Collecting precise, high-resolution operational data (e.g., second-level power usage, chip-level temperature) rather than rough averages.
  • Computing-Power-Cooling All-Relative Data: Securing integrated data to analyze the tight correlations between IT load (computing), power, and cooling systems.

B. Solutions (Adopting Tools)

  • “Living” Digital Twin: Building a digital twin linked in real-time to the actual data center for dynamic simulation and monitoring, going beyond static 3D modeling.
  • LLM AI Agent: Introducing LLM-based AI agents to assist or automate complex data center management tasks.

C. Operations (Innovating Processes)

  • Integration for Multi/Edge(s): Establishing a unified management system that covers not only centralized centers but also distributed multi-cloud and edge locations.
  • DevOps for the Fast: Applying agile DevOps methodologies to development and operations to adapt quickly to the rapidly changing AI infrastructure.

๐Ÿ’ก Summary & Key Takeaways

The slide suggests that traditional operating methods are unsustainable due to the costs and risks associated with AI workloads.

Success in the AI era requires precisely integrating IT and facility data (Digitization), utilizing advanced technologies like Digital Twins and AI Agents (Solutions), and adopting fast, integrated processes (Operations).


#AIDataCenter #AIDC #GenerativeAI #LLM #DataCenterStrategy #DigitalTwin #DevOps #AIInfrastructure #TechTrends #SmartOperations #EnergyEfficiency #EdgeComputing #AIInnovation

With Gemini

Data Center Digitalization

This image presents a roadmap for “Data Center Digitalization” showing the evolutionary process. Based on your explanation, here’s a more accurate interpretation:

Top 4 Core Concepts (Purpose for All Stages)

  • Check Point: Current state inspection and verification point for each stage
  • Respond to change: Rapid response system to quick changes
  • Target Image: Final target state to be achieved
  • Direction: Overall strategic direction setting

Digital Transformation Evolution Stages

Stage 1: Experience-Based Digital Environment Foundation

  • Easy to Use: Creating user-friendly digital environments through experience
  • Integrate Experience: Integrating existing data center operational experience and know-how into the digital environment
  • Purpose: Utilizing existing operational experience as checkpoints to establish a foundation for responding to changes

Stage 2: DevOps Integrated Environment Configuration

  • DevOps: Development-operations integrated environment supporting Fast Upgrade
  • Building efficient development-operations integrated systems based on existing operational experience and know-how
  • Purpose: Implementing DevOps environment that can rapidly respond to changes based on integrated experience

Stage 3: Evolution to Intelligent Digital Environment

  • Digital Twin & AI Agent(LLM): Accumulated operational experience and know-how evolve into digital twins and AI agents
  • Intelligent automated decision-making through Operation Evolutions
  • Purpose: Establishing intelligent systems toward the target image and confirming operational direction

Stage 4: Complete Automation Environment Achievement

  • Robotics: Unmanned operations through physical automation
  • Digital 99.99% Automation: Nearly complete digital automation environment integrating all experience and know-how
  • Purpose: Achieving the final target image – complete digital environment where all experience is implemented as automation

Final Goal: Simultaneous Development of Stability and Efficiency

WIN-WIN Achievement:

  • Stable: Ensuring high availability and reliability based on accumulated operational experience
  • Efficient: Maximizing operational efficiency utilizing integrated know-how

This diagram presents a strategic roadmap where data centers systematically integrate existing operational experience and know-how into digital environments, evolving step by step while reflecting the top 4 core concepts as purposes for each stage, ultimately achieving both stability and efficiency simultaneously.

With Claude

DC Changes

This image shows a diagram that matches 3 Environmental Changes in data centers with 3 Operational Response Changes.

Environmental Changes โ†’ Operational Response Changes

1. Hyper Scale

Environmental Change: Large-scale/Complexity

  • Systems becoming bigger and more complex
  • Increased management complexity

โ†’ Operational Response: DevOps + Big Data/AI Prediction

  • Development-Operations integration through DevOps
  • Intelligent operations through big data analytics and AI prediction

2. New DC (New Data Center)

Environmental Change: New/Edge and various types of data centers

  • Proliferation of new edge data centers
  • Distributed infrastructure environment

โ†’ Operational Response: Integrated Operations

  • Multi-center integrated management
  • Standardized operational processes
  • Role-based operational framework

3. AI DC (AI Data Center)

Environmental Change: GPU Large-scale Computing/Massive Power Requirements

  • GPU-intensive high-performance computing
  • Enormous power consumption

โ†’ Operational Response: Digital Twin – Real-time Data View

  • Digital replication of actual configurations
  • High-quality data-based monitoring
  • Real-time predictive analytics including temperature prediction

This diagram systematically demonstrates that as data center environments undergo physical changes, operational approaches must also become more intelligent and integrated in response.

with Claude

Requires 4 Digitalizations

From DALL-E with some prompting
The image appears to be a flowchart or diagram explaining the requirements for digitalization. It starts on the left and moves to the right, outlining the transition from traditional facility-based operations to data service-based operations.

  • Facility-based Operation: On the top and bottom left, there are icons representing a computer and servers, symbolizing traditional facility-centric operations.
  • Operation Digitalization: In the center, there is a process that represents the transition of these facility-based operations to digitalization. It is labeled ‘Operation Digitalization’ and includes elements like data analysis and service development.
  • Data Service-based Operation: On the top right, icons representing modern data services like cloud computing illustrate the shift from facility-based to data-centric operations.

The bottom section includes the following detailed elements:

  • Enhancing Data Precision & Performance
  • Data Analysis System
  • DC Service Development
  • Data-based Operating

These elements are linked to the required experiences from traditional facilities (Facility Exp) and DC development (DevOps) as well as operational experience (DC Operation Exp). These components emphasize the various skills and experiences necessary for a digital transformation.

The overall diagram provides a high-level view of the different aspects of the digital transformation process, emphasizing that this transformation requires not only technical and operational capabilities but also a change in organizational experience and knowledge.