Power/Cooling impacts to AI Work

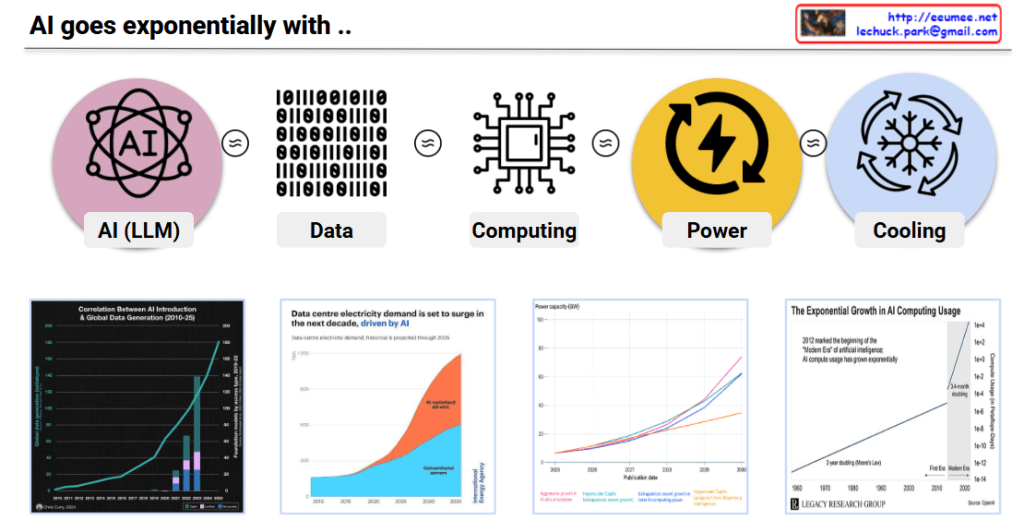
Power/Cooling Impacts on AI Work – Analysis

This slide summarizes research findings on how AI workloads impact power grids and cooling systems.

Key Findings:

๐Ÿ“Š Reliability & Failure Studies

  • Large-Scale ML Cluster Reliability (Meta, 2024/25)
    • 1024-GPU job MTTF (Mean Time To Failure): 7.9 hours
    • 8-GPU job: 47.7 days
    • 16,384-GPU job: 1.8 hours
    • โ†’ Larger jobs = higher failure risk due to cooling/power faults amplifying errors

๐Ÿ”Œ Silent Data Corruption (SDC)

  • SDC in LLM Training (2025)
    • Meta report: 6 SDC failures in 54-day pretraining run
    • Power droop, thermal stress โ†’ hardware faults โ†’ silent errors โ†’ training divergence

โšก Inference Energy Efficiency

  • LLM Inference Energy Consumption (2025)
    • GPT-4o query benchmarks:
      • Short: 0.43 Wh
      • Medium: ~3.71 Wh
    • Batch 4โ†’8: ~43% savings
    • Batch 8โ†’16: ~43% savings per prompt
    • โ†’ PUE & infrastructure efficiency significantly impact inference cost, delay, and carbon footprint

๐Ÿญ Grid-Level Instability

  • AI-Induced Power Grid Disruptions (2024)
    • Model training causes power transients
    • Dropouts โ†’ hardware resets
    • Grid-level instability โ†’ node-level errors (SDC, restarts) โ†’ LLM job failures

๐ŸŽฏ Summary:

  1. Large-scale AI workloads face exponentially higher failure rates – bigger jobs are increasingly vulnerable to power/cooling system issues, with 16K-GPU jobs failing every 1.8 hours.
  2. Silent data corruption from thermal/power stress causes undetected training failures, while inference efficiency can be dramatically improved through batch optimization (43% energy reduction).
  3. AI training creates a vicious cycle of grid instability – power transients trigger hardware faults that cascade into training failures, requiring robust infrastructure design for power stability and fault tolerance.

#AIInfrastructure #MLOps #DataCenterEfficiency #PowerManagement #AIReliability #LLMTraining #SilentDataCorruption #EnergyEfficiency #GridStability #AIatScale #HPC #CoolingSystem #AIFailures #SustainableAI #InferenceOptimization

With Claude

Power for AI

AI Data Center Power Infrastructure: 3 Key Transformations

Traditional Data Center Power Structure (Baseline)

Power Grid โ†’ Transformer โ†’ UPS โ†’ Server (220V AC)

  • Single power grid connection
  • Standard UPS backup (10-15 minutes)
  • AC power distribution
  • 200-300W per server

3 Critical Changes for AI Data Centers

๐Ÿ”ด 1. More Power (Massive Power Supply)

Key Changes:

  • Diversified power sources:
    • SMR (Small Modular Reactor) – Stable baseload power
    • Renewable energy integration
    • Natural gas turbines
    • Long-term backup generators + large fuel tanks

Why: AI chips (GPU/TPU) consume kW to tens of kW per server

  • Traditional server: 200-300W
  • AI server: 5-10 kW (25-50x increase)
  • Total data center power demand: Hundreds of MW scale

๐Ÿ”ด 2. Stable Power (Power Quality & Conditioning)

Key Changes:

  • 800V HVDC system – High-voltage DC transmission
  • ESS (Energy Storage System) – Large-scale battery storage
  • Peak Shaving – Peak load control and leveling
  • UPS + Battery/Flywheel – Instantaneous outage protection
  • Power conditioning equipment – Voltage/frequency stabilization

Why: AI workload characteristics

  • Instantaneous power surges (during inference/training startup)
  • High power density (30-100 kW per rack)
  • Power fluctuation sensitivity – Training interruption = days of work lost
  • 24/7 uptime requirements

๐Ÿ”ด 3. Server Power (High-Efficiency Direct DC Delivery)

Key Changes:

  • Direct-to-Chip DC power delivery
  • Rack-level battery systems (Lithium/Supercapacitor)
  • High-density power distribution

Why: Maximize efficiency

  • Eliminate ACโ†’DC conversion losses (5-15% efficiency gain)
  • Direct chip-level power supply – Minimize conversion stages
  • Ultra-high rack density support (100+ kW/rack)
  • Even minor voltage fluctuations are critical – Chip-level stabilization needed

Key Differences Summary

CategoryTraditional DCAI Data Center
Power ScaleFew MWHundreds of MW
Rack Density5-10 kW/rack30-100+ kW/rack
Power MethodAC-centricHVDC + Direct DC
Backup PowerUPS (10-15 min)Multi-tier (Generator+ESS+UPS)
Power StabilityStandardExtremely high reliability
Energy SourcesSingle gridMultiple sources (Nuclear+Renewable)

Summary

โœ… AI data centers require 25-50x more power per server, demanding massive power infrastructure with diversified sources including SMRs and renewables

โœ… Extreme workload stability needs drive multi-tier backup systems (ESS+UPS+Generator) and advanced power conditioning with 800V HVDC

โœ… Direct-to-chip DC power delivery eliminates conversion losses, achieving 5-15% efficiency gains critical for 100+ kW/rack densities

#AIDataCenter #DataCenterPower #HVDC #DirectDC #EnergyStorageSystem #PeakShaving #SMR #PowerInfrastructure #HighDensityComputing #GPUPower #DataCenterDesign #EnergyEfficiency #UPS #BackupPower #AIInfrastructure #HyperscaleDataCenter #PowerConditioning #DCPower #GreenDataCenter #FutureOfComputing

With Claude

AI goes exponentially with ..

This infographic illustrates how AI’s exponential growth triggers a cascading exponential expansion across all interconnected domains.

Core Concept: Exponential Chain Reaction

Top Process Chain: AI’s exponential growth creates proportionally exponential demands at each stage:

  • AI (LLM) โ‰ˆ Data โ‰ˆ Computing โ‰ˆ Power โ‰ˆ Cooling

The “โ‰ˆ” symbol indicates that each element grows exponentially in proportion to the others. When AI doubles, the required data, computing, power, and cooling all scale proportionally.

Evidence of Exponential Growth Across Domains

1. AI Networking & Global Data Generation (Top Left)

  • Exponential increase beginning in the 2010s
  • Vertical surge post-2020

2. Data Center Electricity Demand (Center Left)

  • Sharp increase projected between 2026-2030
  • Orange (AI workloads) overwhelms blue (traditional workloads)
  • AI is the primary driver of total power demand growth

3. Power Production Capacity (Center Right)

  • 2005-2030 trends across various energy sources
  • Power generation must scale alongside AI demand

4. AI Computing Usage (Right)

  • Most dramatic exponential growth
  • Modern AI era begins in 2012
  • Doubling every 6 months (extremely rapid exponential growth)
  • Over 300,000x increase since 2012
  • Three exponential growth phases shown (1e+0, 1e+2, 1e+4, 1e+6)

Key Message

This infographic demonstrates that AI development is not an isolated phenomenon but triggers exponential evolution across the entire ecosystem:

  • As AI models advance โ†’ Data requirements grow exponentially
  • As data increases โ†’ Computing power needs scale exponentially
  • As computing expands โ†’ Power consumption rises exponentially
  • As power consumption grows โ†’ Cooling systems must expand exponentially

All elements are tightly interconnected, creating a ‘cascading exponential effect’ where exponential growth in one domain simultaneously triggers exponential development and demand across all other domains.


#ArtificialIntelligence #ExponentialGrowth #AIInfrastructure #DataCenters #ComputingPower #EnergyDemand #TechScaling #AIRevolution #DigitalTransformation #Sustainability #TechInfrastructure #MachineLearning #LLM #DataScience #FutureOfAI #TechTrends #TechnologyEvolution

With Claude

AI Stabilization & Optimization

This diagram illustrates the AI Stabilization & Optimization framework addressing the reality where AI’s explosive development encounters critical physical and technological barriers.

Core Concept: Explosive Change Meets Reality Walls

The AI โ†’ Explosion โ†’ Wall (Limit) pathway shows how rapid AI advancement inevitably hits real-world constraints, requiring immediate strategic responses.

Four Critical Walls (Real-World Limitations)

  • Data Wall: Training data depletion
  • Computing Wall: Processing power and memory constraints
  • Power Wall: Energy consumption explosion (highlighted in red)
  • Cooling Wall: Thermal management limits

Dual Response Strategy

Stabilization – Managing Change

Stable management of rapid changes:

  • LM SW: Fine-tuning, RAG, Guardrails for system stability
  • Computing: Heterogeneous, efficient, modular architecture
  • Power: UPS, dual path, renewable mix for power stability
  • Cooling: CRAC control, monitoring for thermal stability

Optimization – Breaking Through/Approaching Walls

Breaking limits or maximizing utilization:

  • LM SW: MoE, lightweight solutions for efficiency maximization
  • Computing: Near-memory, neuromorphic, quantum for breakthrough
  • Power: AI forecasting, demand response for power optimization
  • Cooling: Immersion cooling, heat reuse for thermal innovation

Summary

This framework demonstrates that AI’s explosive innovation requires a dual strategy: stabilization to manage rapid changes and optimization to overcome physical limits, both happening simultaneously in response to real-world constraints.

#AIOptimization #AIStabilization #ComputingLimits #PowerWall #AIInfrastructure #TechBottlenecks #AIScaling #DataCenterEvolution #QuantumComputing #GreenAI #AIHardware #ThermalManagement #EnergyEfficiency #AIGovernance #TechInnovation

With Claude

nVidia DCGM(Data Center GPU Manager) Metrics

nVidia DCGM for GPU Stabilization and Optimization

Purpose and Overview

DCGM (Data Center GPU Manager) metrics provide comprehensive real-time monitoring for GPU cluster stability and performance optimization in data center environments. The system enables proactive issue detection and prevention through systematic metric categorization across utility states, performance profiling, and system identification. This integrated approach ensures uninterrupted high-performance operations while extending hardware lifespan and optimizing operational costs.

GPU Stabilization Through Metric Monitoring

Thermal Stability Management

  • GPU Temperature monitoring prevents overheating
  • Clock Throttle Reasons identifies performance degradation causes
  • Automatic workload redistribution when temperature thresholds are reached

Power Management Optimization

  • Power Usage and Total Energy Consumption tracking
  • Priority-based job scheduling when power limits are approached
  • Energy efficiency-based resource allocation

Memory Integrity Assurance

  • ECC Error Count monitoring for early hardware fault detection
  • Frame Buffer Memory utilization tracking prevents OOM scenarios

Clock Throttling-Based Optimization

The Clock Throttle Reasons bitmask provides real-time detection of GPU performance limitations. Normal operation (0x00000000) maintains peak performance, while power limiting (0x00000001) triggers workload distribution to alternate GPUs. Thermal limiting (0x00000002) activates enhanced cooling and temporarily suspends heat-generating tasks. Complex limitation scenarios prompt emergency workload migration and hardware diagnostics to maintain system stability.

Integrated Optimization Strategy

Predictive Management

  • Metric trend analysis for proactive issue prediction
  • Workload pattern learning for optimal resource pre-allocation

Dynamic Scaling

  • SM/DRAM Active Cycles Ratio enables real-time load balancing
  • PCIe/NVLink Throughput optimization for network efficiency

Fault Prevention

  • Rising ECC Error Count triggers GPU isolation and replacement scheduling
  • Driver Version and Process Name tracking resolves compatibility issues

With Claude