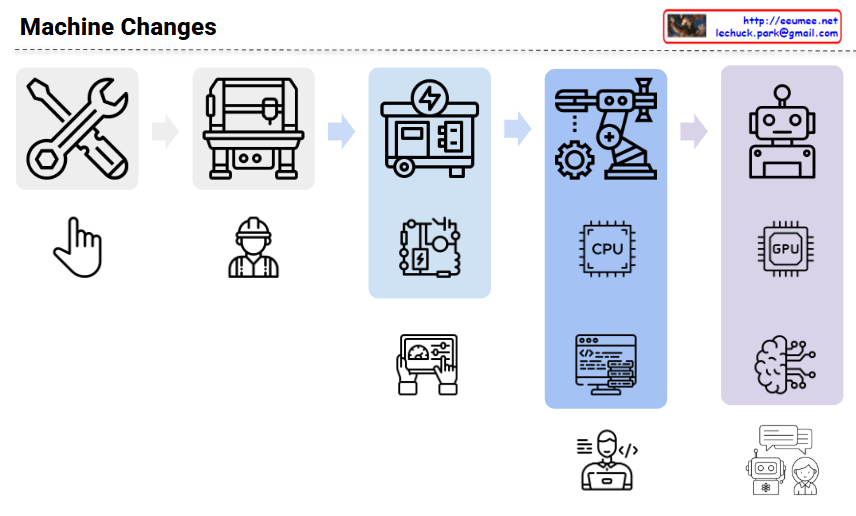
Power Usage of Cooling

Data Center Cooling System Power Usage Analysis

This diagram illustrates the cooling system configuration of a data center and the power consumption proportions of each component.

Cooling Facility Stages:

  1. Cooling Tower: The first stage, generating Cooling Water through contact between outside air and water.
  2. Chiller: Receives cooling water and converts it to Chilled Water at a lower temperature through the compressor.
  3. CRAH (Computer Room Air Handler): Uses chilled water to produce Cooling Air for the server room.
  4. Server Rack Cooling: Finally, cooling air reaches the server racks and absorbs heat.

Several auxiliary devices operate in this process:

  • Pump: Regulates the pressure and speed of cooling water and chilled water.
  • Header: Efficiently distributes and collects water.
  • Heat Exchanger: Optimizes the heat transfer process.
  • Fan: Circulates cooling air.

Cooling Facility Power Usage Proportions:

  • Chiller/Compressor: The largest power consumer, accounting for 60-80% of total cooling power.
  • Pump: Consumes 10-15% of power.
  • Cooling Tower: Uses approximately 10% of power.
  • CRAH/Fan: Uses approximately 10% of power.
  • Other components: Account for the remaining 10%.

Purpose of Energy Usage (Efficiency):

  • As indicated in the blue box on the lower right, “Most of the power is to lower the temperature and transfer it.”
  • The system operates through Supply and Return loops to remove heat from the “Sources of heat.”
  • The note “100% Free Cooling = Chiller Not working” indicates that when using natural cooling methods, the most power-intensive component (the chiller) doesn’t need to operate, potentially resulting in significant energy efficiency improvements.

This data center cooling system diagram illustrates how cooling moves from Cooling Tower to Chiller to CRAH to server racks, with compressors consuming the majority (60-80%) of power usage, followed by pumps (10-15%) and other components (10% each). The system primarily functions to lower temperatures and transfer heat, with the important insight that 100% free cooling eliminates the need for chillers, potentially saving significant energy.

With Claude

EEUMEE (AI-Block share)

The diagram illustrates a blockchain-based AI service system where:

  • At the center is a blockchain network (represented by an interconnected cube structure in a blue square) labeled “All transaction in a Block-chain”
  • Connected to this central blockchain are several components:
    • On the left: A personal AI agent connected to a person with a shopping cart
    • On the top right: A personal AI agent connected to what appears to be a chef or cook
    • On the bottom right: A personal AI agent connected to what looks like a farmer or gardener
    • At the bottom: A money/payment symbol (showing a coin with a dollar sign)

The arrows indicate connections or transactions between these components through the blockchain.

This appears to be illustrating a system where personal AI agents serve different user types (shoppers, cooks, farmers) with their transactions recorded on a blockchain.

With Claude

MCP #1 _ flow

MCP Overview

MCP (Model Context Protocol) is a conversion interface designed to enable LLMs (Large Language Models) to effectively interact with external resources. This protocol transforms text-format queries into API calls to access specific resources, allowing LLMs to provide more accurate and useful responses.

Key Components

  1. MCP Client: Interface that receives user questions, processes them, and returns final answers
  2. MCP Server: Server that converts text to API calls and communicates with specific resources
  3. LLM: Language model that analyzes questions and generates answers utilizing resource information

Operational Flow

  1. User submits a question to the MCP Client
  2. MCP Client forwards external resource requests to the MCP Server
  3. MCP Server transforms text-format requests into API call format
  4. MCP Server executes API calls to specific resources
  5. Resources return results to the MCP Server
  6. MCP Server provides resource information to the MCP Client
  7. LLM analyzes the question and generates an answer using all provided resources
  8. MCP Client returns the final answer to the user

Core Features

  • Provides an interface for converting text-based requests to API calls
  • Enables access to specific resource solutions
  • Integrates seamlessly with LLMs
  • Generates enhanced responses by leveraging external data sources

With Claude

CFD + AI/ML for Digital Twin 2

Digital Twin System Using CFD and AI/ML

This diagram illustrates the complete lifecycle of a digital twin system, showing how CFD (Computational Fluid Dynamics) and AI/ML play crucial roles at different stages.

Key Stages

  1. Design:
    • CFD plays a critical role at this stage
    • Establishes the foundation through geometric modeling, physical property definition, and boundary condition setup
    • Accurate physical simulation at this stage forms the basis for future predictions
  2. Build:
    • Implementation stage for the designed model
    • Integration of both CFD models and AI/ML models
  3. Operate:
    • AI/ML plays a critical role at this stage
    • System performance prediction and optimization based on real-time data
    • Continuous model improvement by learning from operational data

Technology Integration Process

  • CFD Track:
    • Provides accurate physical modeling during the design phase
    • Defines geometry, physics, and boundary conditions to establish the basic structure
    • Verifies model accuracy through validation processes
    • Updates the model according to changes during operation
  • AI/ML Track:
    • Configures learning data and defines metrics
    • Sets up data lists and resolution
    • Provides predictive models using real-time data during the operation phase
    • Continuously improves prediction accuracy by learning from operational data

Cyclical Improvement System

The key to this system is that physical modeling (CFD) at the design stage and data-driven prediction (AI/ML) at the operation stage work complementarily to form a continuous improvement cycle. Real data collected during operation is used to update the AI/ML models, which in turn contributes to improving the accuracy of the CFD models.

With Claude

Home LLM

This image shows the architecture of a “Home LLM” system, illustrating an innovative change in how home appliances are used.

Key points:

  1. Evolution from Traditional Approach: While traditional electronics came as ‘product + paper manual’ packages, this new system replaces manuals with small LLM models.
  2. Home Foundation Model: Homes are equipped with a main LLM model (“Home Foundation LLM Model”) that learns from environmental data.
  3. Knowledge Exchange: Product-specific small LLM models and the home foundation model exchange data and learning outcomes with each other.
  4. User Interface: Users can easily interact through the LLM by asking questions and giving commands, making product usage much more intuitive and convenient.
  5. AI Agent Control: Additionally, AI agents automatically optimize the control of these products, increasing efficiency.

This system presents a smart home architecture that fundamentally improves the user experience of electronic products by integrating AI and LLM technologies in the home environment.

With Claude