Verification: Validate speed, resource usage through benchmarking and profiling
Summary:
Optimization aims to increase speed and reduce resources by removing unnecessary operations. It follows a staged approach starting from software-level improvements and extending to hardware implementation when needed. The process ensures predictable, verifiable results through deterministic inputs/outputs and rule-based methods.
PUE Improvement: Power Usage Effectiveness (overall power efficiency metric)
Key Message
This diagram emphasizes that for successful AI implementation:
Technical Foundation: Both Data/Chips (Computing) and Power/Cooling (Infrastructure) are necessary
Tight Integration: These two axes are not separate but must be firmly connected like a chain and optimized simultaneously
Implementation Technologies: Specific advanced technologies for stability and optimization in each domain must provide support
The central link particularly visualizes the interdependent relationship where “increasing computing power requires strengthening energy and cooling in tandem, and computing performance cannot be realized without infrastructure support.”
Summary
AI systems require two inseparable pillars: Computing (Data/Chips) and Infrastructure (Power/Cooling), which must be tightly integrated and optimized together like links in a chain. Each pillar is supported by advanced technologies spanning from AI model optimization (FlashAttention, Quantization) to next-gen hardware (GB200, TPU) and sustainable infrastructure (SMR, Liquid Cooling, AI-driven optimization). The key insight is that scaling AI performance demands simultaneous advancement across all layers—more computing power is meaningless without proportional energy supply and cooling capacity.
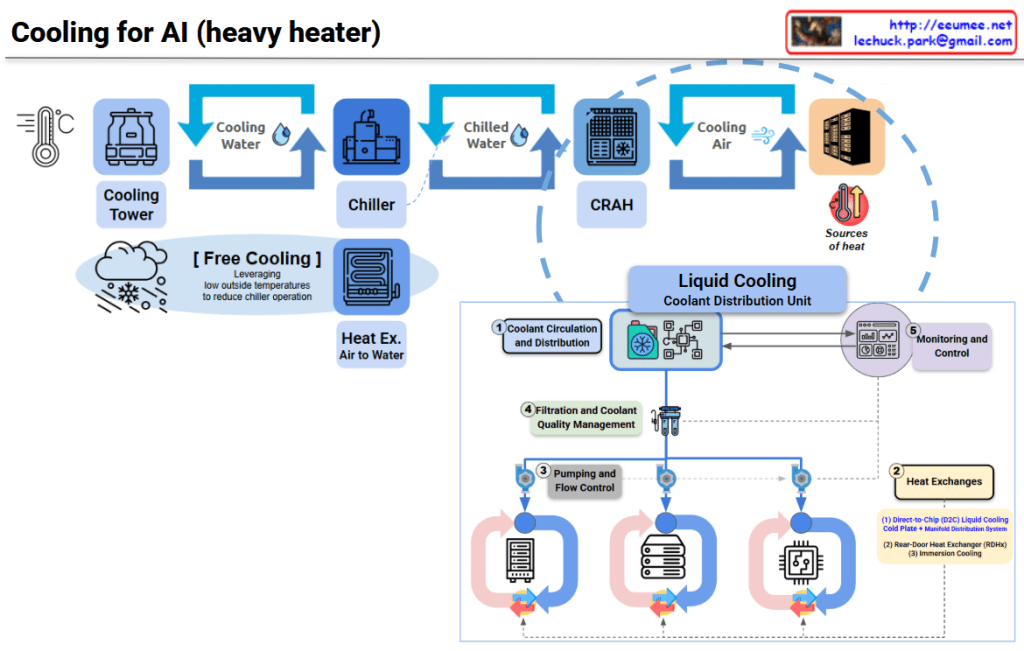
AI Data Center Cooling System Architecture Analysis
This diagram illustrates the evolution of data center cooling systems designed for high-heat AI workloads.
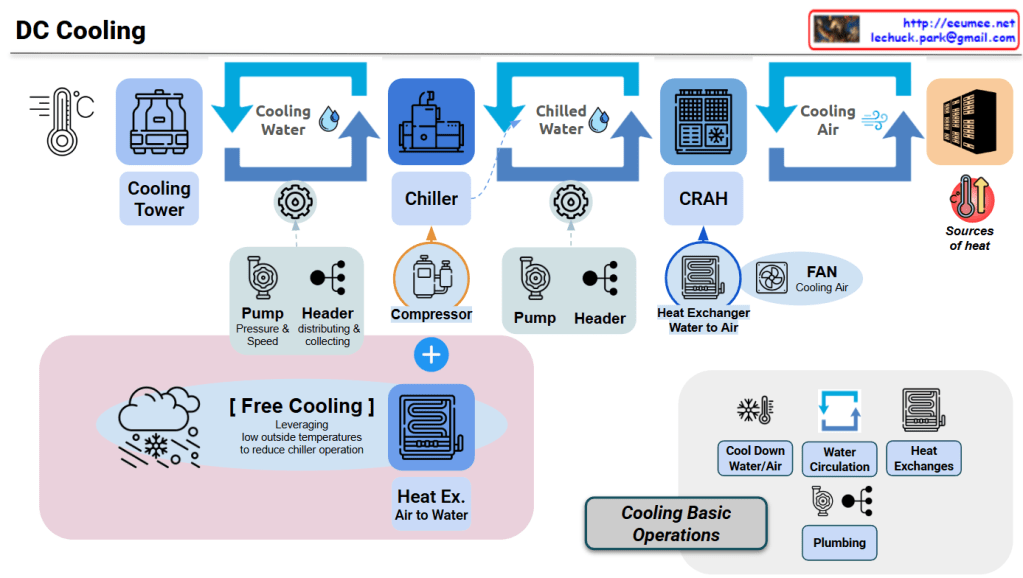
Traditional Cooling System (Top Section)
Three-Stage Cooling Process:
Cooling Tower – Uses ambient air to cool water
Chiller – Further refrigerates the cooled water
CRAH (Computer Room Air Handler) – Distributes cold air to the server room
Free Cooling option is shown, which reduces chiller operation by leveraging low outside temperatures for energy savings.
New Approach for AI DC: Liquid Cooling System (Bottom Section)
To address extreme heat generation from high-density AI chips, a CDU (Coolant Distribution Unit) based liquid cooling system has been introduced.
Key Components:
① Coolant Circulation and Distribution
Direct coolant circulation system to servers
② Heat Exchanges (Two Methods)
Direct-to-Chip (D2C) Liquid Cooling: Cold plate with manifold distribution system directly contacting chips
Rear-Door Heat Exchanger (RDHx): Heat exchanger mounted on rack rear door (immersion cooling)
③ Pumping and Flow Control
Pumps and flow control for coolant circulation
④ Filtration and Coolant Quality Management
Maintains coolant quality and removes contaminants
⑤ Monitoring and Control
Real-time monitoring and cooling performance control
Critical Differences
Traditional Method: Air cooling → Indirect, suitable for low-density workloads
AI DC Method: Liquid cooling → Direct, high-efficiency, capable of handling high TDP (Thermal Design Power) of AI chips
Liquid has approximately 25x better heat transfer efficiency than air, making it effective for cooling AI accelerators (GPUs, TPUs) that generate hundreds of watts to kilowatt-level heat.
Summary:
Traditional data centers use air-based cooling (Cooling Tower → Chiller → CRAH), suitable for standard workloads.
AI data centers require liquid cooling with CDU systems due to extreme heat from high-density AI chips.
Liquid cooling offers direct-to-chip heat removal with 25x better thermal efficiency than air, supporting kW-level heat dissipation.
Large-scale AI workloads face exponentially higher failure rates – bigger jobs are increasingly vulnerable to power/cooling system issues, with 16K-GPU jobs failing every 1.8 hours.
Silent data corruption from thermal/power stress causes undetected training failures, while inference efficiency can be dramatically improved through batch optimization (43% energy reduction).
AI training creates a vicious cycle of grid instability – power transients trigger hardware faults that cascade into training failures, requiring robust infrastructure design for power stability and fault tolerance.
Plumbing: Manages circulation paths and pressure loss
Heat Flow Summary
Server Heat → Air → CRAH (Heat Exchange) → Chilled Water → Chiller (Heat Exchange) →
Cooling Water → Cooling Tower → Atmospheric Discharge
Summary
This system efficiently removes server heat to the outdoor atmosphere through three cascading circulation loops (air → chilled water → cooling water) and three strategic heat exchange points (CRAH, Chiller, Cooling Tower). Free cooling optimization reduces energy consumption by up to 50% when outdoor conditions permit. The integrated pump/header network ensures precise flow control across all loops for maximum cooling efficiency.