What to do first

From Claude with some prompting
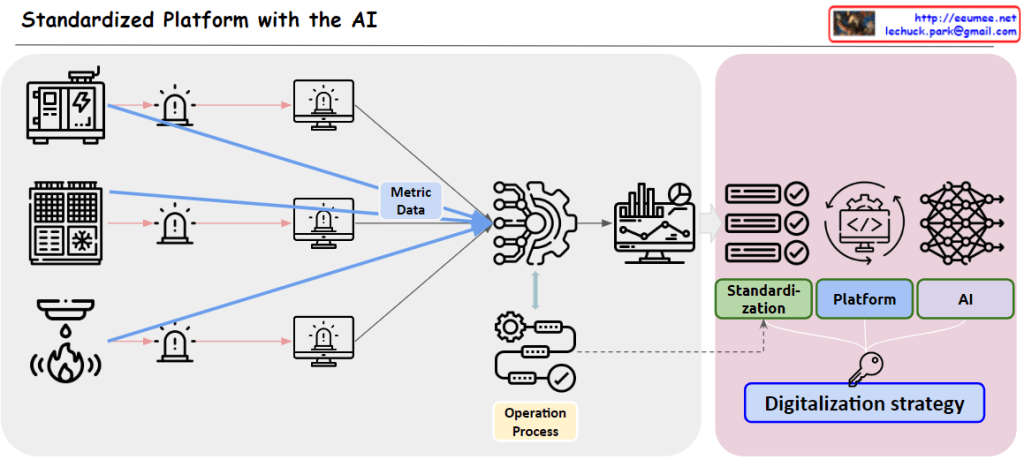
This image outlines a progressive approach to data monitoring and alert systems, starting with simple metrics and evolving to more complex AI-driven solutions. The key steps are:

  1. “Keeping a Temperature”: Basic monitoring of system temperatures.
  2. “Monitoring”: Continuous observation of temperature data.
  3. “Alerts with thresholds”: Simple threshold-based alerts.
  4. More complex metrics: Including 10-minute thresholds, change counts, averages, and derivations.
  5. “More Indicators”: Expanding to additional KPIs and metrics.
  6. “Machine Learning ARIMA/LSTM”: Implementing advanced predictive models.
  7. “Alerts with predictions”: AI-driven predictive alerts.

The central message “EASY FIRST BEFORE THE AI !!” emphasizes starting with simpler methods before advancing to AI solutions.

Importantly, the image also implies that these simpler metrics and indicators established early on will later serve as valuable training data for AI models. This is shown by the arrows connecting all stages to the machine learning component, suggesting that the data collected throughout the process contributes to the AI’s learning and predictive capabilities.

This approach not only allows for a gradual build-up of system complexity but also ensures that when AI is implemented, it has a rich dataset to learn from, enhancing its effectiveness and accuracy.

Standardized Platform with the AI

From Claude with some prompting
This image illustrates a “Standardized Platform with the AI”. Here’s a breakdown of the key components and processes:

  1. Left side: Various devices or systems (generator, HVAC system, fire detector, etc.) are shown. Each device is connected to an alarm system and a monitoring screen.
  2. Center: “Metric Data” from these devices is sent to a central gear-shaped icon, representing a data processing system.
  3. Upper right: The processed data is displayed on a dashboard or analytics screen.
  4. Lower right: There’s a section labeled “Operation Process”, indicating management or optimization of operational processes.
  5. Far right: Boxes representing the system’s components:
    • “Standardization”
    • “Platform”
    • “AI”
  6. Bottom: “Digitalization strategy” serves as the foundation for the entire system.

This diagram visualizes a digital transformation strategy that collects data from various systems and devices, processes it using AI on a standardized platform, and uses this to optimize and manage operations.

The flow shows how raw data from different sources is standardized, processed, and utilized to create actionable insights and improve operational efficiency, all underpinned by a comprehensive digitalization strategy.

For the Same Traffic metering

From Claude with some prompting
“For the Same Traffic Metering” – Key Points:

  1. Problem: Different collection servers using SNMP may not yield the same results for identical traffic.
  2. Main causes of discrepancy:
    • Network equipment updates traffic information periodically.
    • To get consistent values, SNMP requests must align with the equipment’s update cycle.
    • Difficult to synchronize requests precisely across multiple servers.
  3. Challenges for resolution:
    • Servers need accurate time synchronization.
    • All requests should occur within the same ‘Update Cycle’ of the equipment.
  4. Time synchronization:
    • NTP can partially solve the issue.
    • Perfect (100%) synchronization is not achievable in practice.
  5. Consequence: SNMP data collected from multiple servers may show different results for the same traffic.
  6. Key insight: The image emphasizes the difficulties in accurate data collection using SNMP in network monitoring systems.
  7. Implications: Network administrators and system designers must be aware of these limitations and consider them when collecting and interpreting data.

This summary highlights the complexities involved in ensuring consistent traffic metering across multiple collection points in a network environment.

Simple & Complex

This image illustrates the evolution of problem-solving approaches, contrasting traditional methods with modern AI-based solutions:

‘Before’ stage:

  1. Starts with Simple data
  2. Proceeds through Research
  3. Find out Rules with formula
  4. Resolves Complex problems

This process represents the traditional approach where humans collect simple data, conduct research, and discover rules to solve complex problems.

‘Now with AI Infra’ stage:

  1. Begins with Simple data
  2. Accumulates too much Simple data
  3. Utilizes Computing for big data and Computing AI
  4. Solves Complex problems by too much simple

This new process showcases a modern approach based on AI infrastructure. It involves analyzing vast amounts of simple data using computational power to address more evolved forms of complexity.

The ‘Complex Evolution’ arrow indicates that the level of complexity we can handle is evolving due to this shift in approach.

In essence, the image conveys that while the past relied on limited data to discover simple rules for solving complexity, the present leverages AI and big data to analyze enormous amounts of simple data, enabling us to tackle more sophisticated and complex problems. This shift represents a significant evolution in our problem-solving capabilities, allowing us to address complexities that were previously beyond our reach.

Operation with AI

From Claude with some prompting
This diagram illustrates an integrated approach to modern operational management. The system is divided into three main components: data generation, data processing, and AI application.

The Operation & Biz section shows two primary data sources. First, there’s metric data automatically generated by machines such as servers and network equipment. Second, there’s textual data created by human operators and customer service representatives, primarily through web portals.

These collected data streams then move to the central Data Processing stage. Here, metric data is processed through CPUs and converted into time series data, while textual data is structured via web business services.

Finally, in the AI play stage, different AI models are applied based on data types. For time series data, models like RNN, LSTM, and Auto Encoder are used for predictive analytics. Textual data is processed through a Large Language Model (LLM) to extract insights.

This integrated system effectively utilizes data from various sources to improve operational efficiency, support data-driven decision-making, and enable advanced analysis and prediction through AI. Ultimately, it facilitates easy and effective management even in complex operational environments.

The image emphasizes how different types of data – machine-generated metrics and human-generated text – are processed and analyzed using appropriate AI techniques, all from the perspective of operational management.

Data Center Management Upgrade

From Claude with some prompting
explain the image in more detail from the data collection perspective and how the data analysis platform facilitates the expansion of AI services.

First, we can see the data collection stage where data is gathered from various systems within the data center building, such as electrical, mechanical, security, and so on, through subsystems like EPMS, BAS, ETC. This collected data is stored in the Data Gathering DB.

Next, this accumulated data is transmitted to the Data Analysis Platform via an API. The necessity of the data analysis platform arises from the need to process the vast amount of collected data and derive meaningful insights.

Within the Data Analysis Platform, tools like Query, Program, and Visualization are utilized for data analysis and monitoring purposes. Based on this, services such as Energy Optimization and Predictive Failure Detection are provided.

Furthermore, by integrating AI technology, data-driven insights can be enhanced. AI models can leverage the data and services from the data analysis platform to perform advanced analytics, automated decision-making, and more.

In summary, the flow is as follows: Data Collection -> Data Processing/Analysis on the Data Analysis Platform -> Provision of services like Energy Optimization and Failure Prediction -> Integration of AI technology for advanced analysis and automation, all contributing to effective data center management.

Why digitalization?

From Claude with some prompting
The image depicts the effects of digitalization in three distinct stages:

Stage 1: Long-Term Accumulated Efficiency Gains Initially, efforts towards digitalization, such as standardization, automation, system and data-based work, may not yield visible results for a considerable amount of time. However, during this period, continuous improvement and optimization gradually lead to an accumulation of efficiency gains.

Stage 2: Eventual Leaps Once the efforts from Stage 1 reach a critical point, significant performance improvements and innovative breakthroughs occur, backed by the experience and learning acquired. The previously accumulated data and process improvement know-how enable these sudden leaps forward.

Stage 3: Extensive Huge Upturn with Big Data & AI Through digitalization, big data is built, and when combined with artificial intelligence technologies, unprecedented and massive levels of performance can be achieved. Data-driven predictions and automated decision-making enable disruptive value creation across a wide range of domains.

Therefore, while the initial stage of digital transformation may seem to yield minimal visible gains, persevering with continuous efforts will allow the accumulation of experience and data, eventually opening up opportunities for rapid innovation and large-scale growth. The key is to maintain patience and commitment, as the true potential of digitalization can be unlocked through the combination of data and advanced technologies like AI.