AI Workload

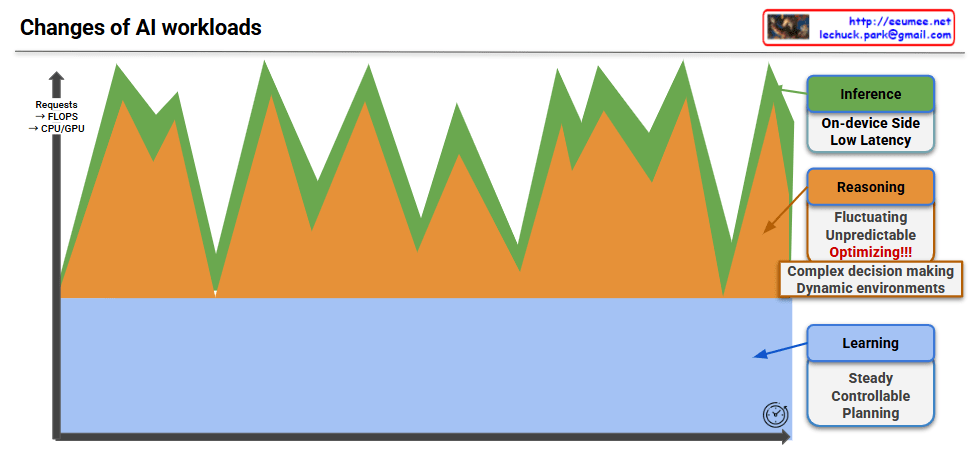
This image visualizes the three major AI workload types and their characteristics in a comprehensive graph.

Graph Structure Analysis

Visualization Framework:

  • Y-axis: AI workload intensity (requests per hour, FLOPS, CPU/GPU utilization, etc.)
  • X-axis: Time progression
  • Stacked Area Chart: Shows the proportion and changes of three workload types within the total AI system load

Three AI Workload Characteristics

1. Learning – Blue Area

Properties: Steady, Controllable, Planning

  • Located at the bottom with a stable, wide area
  • Represents model training processes with predictable and plannable resource usage
  • Maintains consistent load over extended periods

2. Reasoning – Yellow Area

Properties: Fluctuating, Unpredictable, Optimizing!!!

  • Middle layer showing dramatic fluctuations
  • Involves complex decision-making and logical reasoning processes
  • Most unpredictable workload requiring critical optimization
  • Load varies significantly based on external environmental changes

3. Inference – Green Area

Properties: On-device Side, Low Latency

  • Top layer with irregular patterns
  • Executes on edge devices or user terminals
  • Service workload requiring real-time responses
  • Low latency is the core requirement

Key Implications

Differentiated Resource Management Strategies Required:

  • Learning: Stable long-term planning and infrastructure investment
  • Reasoning: Dynamic scaling and optimization technology focus
  • Inference: Edge optimization and response time improvement

This graph provides crucial insights demonstrating that customized resource allocation strategies considering the unique characteristics of each workload type are essential for effective AI system operations.

This visualization emphasizes that AI workloads are not monolithic but consist of distinct components with varying demands, requiring sophisticated resource management approaches to handle their collective and individual requirements effectively.

With Claude

AI Platform eating all

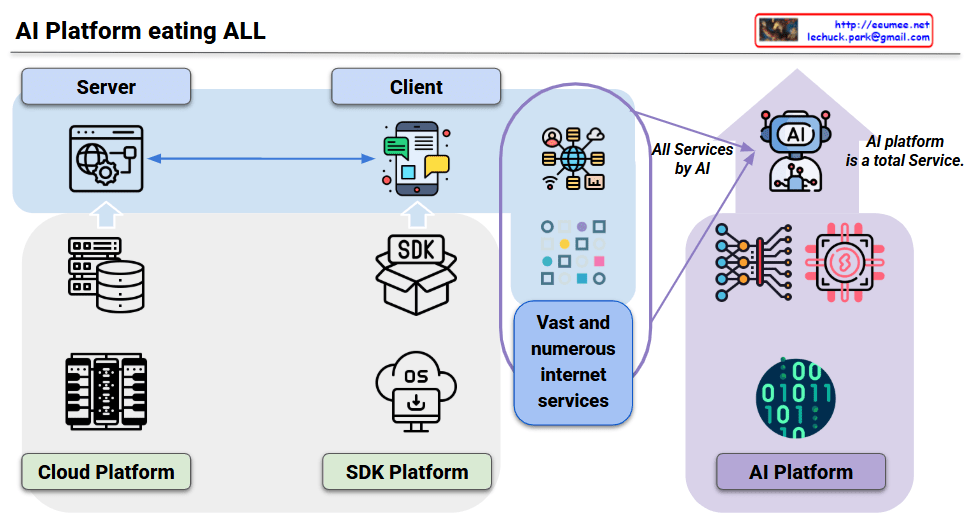
This diagram illustrates the fundamental paradigm shift in service development across three platform evolution stages.

Platform Evolution:

  1. Cloud Platform
    • Server-Client separation with cloud infrastructure development
    • Developers directly build servers and databases to provide services
  2. SDK Platform
    • Client-side evolution based on specific OS/SDK ecosystems (iOS, Android, Windows)
    • Each platform provides development environments and tools
    • This stage generated “Vast and numerous internet services” – an explosive growth of diverse internet services
  3. AI Platform – “Eating ALL”
    • Fundamental paradigm shift: Instead of developers building individual services, the AI platform itself generates and provides services
    • “All Services by AI”: AI directly provides the diverse services that developers previously created
    • Multimodal capabilities: AI can understand and process all human senses and communication methods (language, vision, audio), enabling all functionalities through natural language conversation without specialized apps or services

Key Transformation:

  • Traditional: Developer → Platform → Service Development → User
  • AI Era: User → AI Platform → Instant Service Generation/Provision

This represents not just tool evolution, but a fundamental reorganization of the service ecosystem where countless specialized services converge into one unified AI platform due to AI’s universal cognitive abilities. The AI platform becomes a total service provider, essentially “eating” all existing service categories.

With Claude

Components for AI Work

This diagram visualizes the core concept that all components must be organically connected and work together to successfully operate AI workloads.

Importance of Organic Interconnections

Continuity of Data Flow

  • The data pipeline from Big Data → AI Model → AI Workload must operate seamlessly
  • Bottlenecks at any stage directly impact overall system performance

Cooperative Computing Resource Operations

  • GPU/CPU computational power must be balanced with HBM memory bandwidth
  • SSD I/O performance must harmonize with memory-processor data transfer speeds
  • Performance degradation in one component limits the efficiency of the entire system

Integrated Software Control Management

  • Load balancing, integration, and synchronization coordinate optimal hardware resource utilization
  • Real-time optimization of workload distribution and resource allocation

Infrastructure-based Stability Assurance

  • Stable power supply ensures continuous operation of all computing resources
  • Cooling systems prevent performance degradation through thermal management of high-performance hardware
  • Facility control maintains consistency of the overall operating environment

Key Insight

In AI systems, the weakest link determines overall performance. For example, no matter how powerful the GPU, if memory bandwidth is insufficient or cooling is inadequate, the entire system cannot achieve its full potential. Therefore, balanced design and integrated management of all components is crucial for AI workload success.

The diagram emphasizes that AI infrastructure is not just about having powerful individual components, but about creating a holistically optimized ecosystem where every element supports and enhances the others.

With Claude

ALL to LLM

This image is an architecture diagram titled “ALL to LLM” that illustrates the digital transformation of industrial facilities and AI-based operational management systems.

Left Section (Industrial Equipment):

  • Cooling tower (cooling system)
  • Chiller (refrigeration/cooling equipment)
  • Power transformer (electrical power conversion equipment)
  • UPS (Uninterruptible Power Supply)

Central Processing:

  • Monitor with gears: Equipment data collection and preprocessing system
  • Dashboard interface: “All to Bit” analog-to-digital conversion interface
  • Bottom gears and human icon: Manual/automated operational system management

Right Section (AI-based Operations):

  • Purple area with binary code (0s and 1s): All facility data converted to digital bit data
  • Robot icons: LLM-based automated operational systems
  • Document/analysis icons: AI analysis results and operational reports

Overall, this diagram represents the transformation from traditional manual or semi-automated industrial facility operations to a fully digitized system where all operational data is converted to bit-level information and managed through LLM-powered intelligent facility management and predictive maintenance in an integrated operational system.

With Claude

Digital Op.

Digital Operation Framework

Left Side – Fundamental Operating Characteristics:

  • Operation: Basic operational system
  • Stable: Stable operation
  • Efficient: Efficient operation
  • Trade-off exists between these two characteristics

Center – Digital Transformation:

  • “By Digital”: Core of change through digital technology
  • Win-Win: Achieving both stability and efficiency simultaneously through digitalization

Right Side – Implementation Directions (Updated Interpretation):

  1. Base Mission – Safe Operation
    • Predictive Operation
    • Automation
    • → Building a safe operational environment
  2. How-to Mission – Digitalization
    • Cost Down
    • → Specific implementation methods through digital technology
  3. Critical Mission – Operating/Energy Cost Reduction
    • Labor (workforce management)
    • Energy (energy management)
    • → Key areas for cost reduction

Core Message (Updated)

This framework demonstrates how digital technology can resolve the traditional trade-off between stability and efficiency. The approach is to establish safe operations as the foundation, utilize digitalization as the implementation method, and ultimately achieve reduction in both operating costs and energy costs.

The diagram shows a strategic pathway where digital transformation enables organizations to move beyond the traditional stability-efficiency dilemma toward a comprehensive cost optimization model.