nVidia DCGM(Data Center GPU Manager) Metrics

nVidia DCGM for GPU Stabilization and Optimization

Purpose and Overview

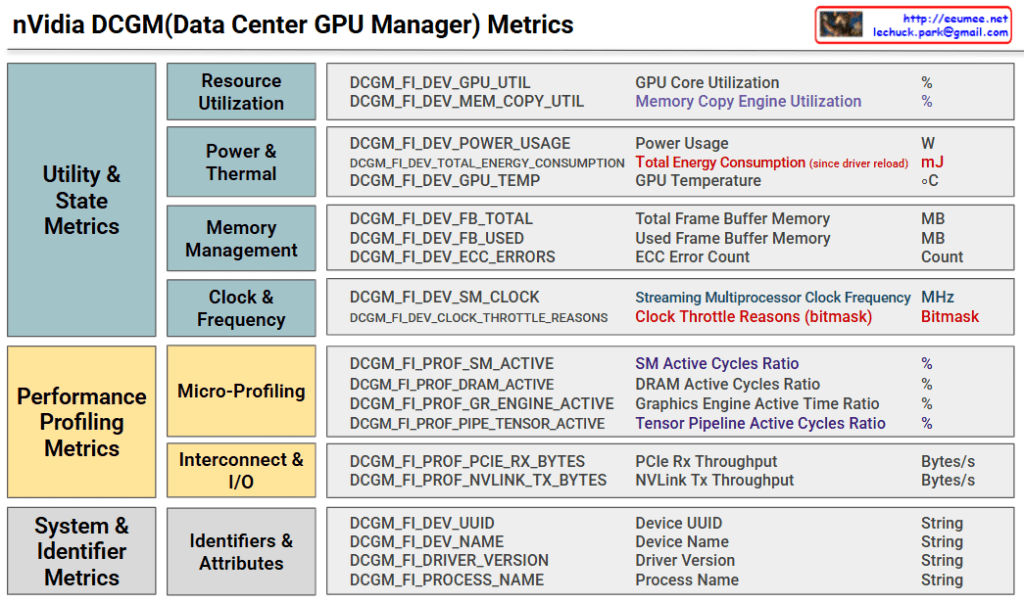
DCGM (Data Center GPU Manager) metrics provide comprehensive real-time monitoring for GPU cluster stability and performance optimization in data center environments. The system enables proactive issue detection and prevention through systematic metric categorization across utility states, performance profiling, and system identification. This integrated approach ensures uninterrupted high-performance operations while extending hardware lifespan and optimizing operational costs.

GPU Stabilization Through Metric Monitoring

Thermal Stability Management

  • GPU Temperature monitoring prevents overheating
  • Clock Throttle Reasons identifies performance degradation causes
  • Automatic workload redistribution when temperature thresholds are reached

Power Management Optimization

  • Power Usage and Total Energy Consumption tracking
  • Priority-based job scheduling when power limits are approached
  • Energy efficiency-based resource allocation

Memory Integrity Assurance

  • ECC Error Count monitoring for early hardware fault detection
  • Frame Buffer Memory utilization tracking prevents OOM scenarios

Clock Throttling-Based Optimization

The Clock Throttle Reasons bitmask provides real-time detection of GPU performance limitations. Normal operation (0x00000000) maintains peak performance, while power limiting (0x00000001) triggers workload distribution to alternate GPUs. Thermal limiting (0x00000002) activates enhanced cooling and temporarily suspends heat-generating tasks. Complex limitation scenarios prompt emergency workload migration and hardware diagnostics to maintain system stability.

Integrated Optimization Strategy

Predictive Management

  • Metric trend analysis for proactive issue prediction
  • Workload pattern learning for optimal resource pre-allocation

Dynamic Scaling

  • SM/DRAM Active Cycles Ratio enables real-time load balancing
  • PCIe/NVLink Throughput optimization for network efficiency

Fault Prevention

  • Rising ECC Error Count triggers GPU isolation and replacement scheduling
  • Driver Version and Process Name tracking resolves compatibility issues

With Claude

Multi-DCs Operation with a LLM (4)

LLM-Based Multi-Datacenter Operation System

System Architecture

3-Stage Processing Pipeline: Collector โ†’ Integrator โ†’ Analyst

  • Event collection from various protocols
  • Data normalization through local integrators
  • Intelligent analysis via LLM/AI analyzers
  • RAG data expansion through bottom Data Add-On modules

Core Functions

1. Time-Based Event Aggregation Analysis

  • 60-second intervals (adjustable) for event bundling
  • Comprehensive situational analysis instead of individual alarms
  • LLM queries with predefined prompts

Effectiveness:

  • โœ… Resolves alarm fatigue and enables correlation analysis
  • โœ… Improves operational efficiency through periodic comprehensive reports
  • โš ๏ธ Potential delay in immediate response to critical issues ( -> Using a legacy/local monitoring system )

2. RAG-Based Data Enhancement

  • Extension data: Metrics, manuals, configurations, maintenance records
  • Reuse of past analysis results as learning data
  • Improved accuracy through domain-specific knowledge accumulation

Effectiveness:

  • โœ… Continuous improvement of analysis quality and increased automation
  • โœ… Systematization of operational knowledge and organizational capability enhancement

Innovative Value

  • Paradigm Shift: Reactive โ†’ Predictive/Contextual analysis
  • Operational Burden Reduction: Transform massive alarms into meaningful insights
  • Self-Evolution: Continuous learning system through RAG framework

Executive Summary: This system overcomes the limitations of traditional individual alarm approaches and represents an innovative solution that intelligentizes datacenter operations through time-based event aggregation and LLM analysis. As a self-evolving monitoring system that continuously learns and develops through RAG-based data enhancement, it is expected to dramatically improve operational efficiency and analysis accuracy.

With Claude

Switching of the power

This diagram illustrates two main power switching methods used in electrical systems: ATS (Automatic Transfer Switch) and STS (Static Transfer Switch).

System Configuration

  • Power Sources: Utility grid and Generator
  • Protection: UPS systems
  • Load: Server infrastructure

ATS (Automatic Transfer Switch)

Location: Switchgear Area (Power Distribution Board)

Characteristics:

  • Mechanism: Mechanical breakers/contacts
  • Transfer Time: Several seconds (including generator start-up)
  • Advantages: Relatively simple, lower cost
  • Application: Standard power transfer systems

STS (Static Transfer Switch)

Location: Panelboard Area (Distribution Panel)

Characteristics:

  • Mechanism: Semiconductor devices (SCR, IGBT)
  • Transfer Time: A few milliseconds (near seamless)
  • Advantages: Ensures high-quality power supply
  • Disadvantages: Expensive

Key Differences

  1. Transfer Speed: STS is significantly faster (milliseconds vs seconds)
  2. Technology: ATS uses mechanical switching, STS uses electronic switching
  3. Cost: ATS is more economical
  4. Power Quality: STS provides more stable power delivery
  5. Complexity: STS requires more sophisticated semiconductor control

Applications

  • ATS: Suitable for applications that can tolerate brief power interruptions
  • STS: Critical for sensitive equipment like servers, data centers, and medical facilities requiring uninterrupted power

Summary: This diagram shows a redundant power system where ATS provides cost-effective backup power switching while STS offers near-instantaneous transfer for critical loads. Both systems work together with UPS backup to ensure continuous power supply to servers and sensitive equipment.

With Claude

LLM Efficiency with a Cooling

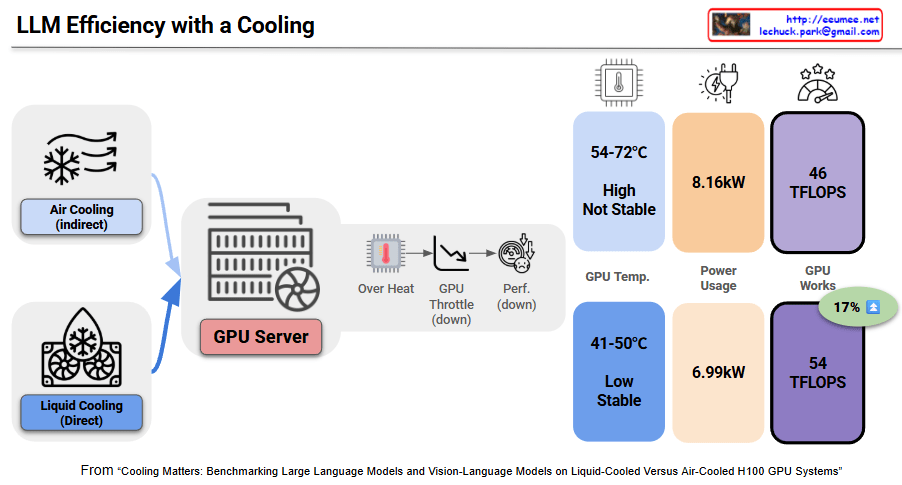
This image demonstrates the critical impact of cooling stability on both LLM performance and energy efficiency in GPU servers through benchmark results.

Cascading Effects of Unstable Cooling

Problems with Unstable Air Cooling:

  • GPU Temperature: 54-72ยฐC (high and unstable)
  • Thermal throttling occurs – where GPUs automatically reduce clock speeds to prevent overheating, leading to significant performance degradation
  • Result: Double penalty of reduced performance + increased power consumption

Energy Efficiency Impact:

  • Power Consumption: 8.16kW (high)
  • Performance: 46 TFLOPS (degraded)
  • Energy Efficiency: 5.6 TFLOPS/kW (poor performance-to-power ratio)

Benefits of Stable Liquid Cooling

Temperature Stability Achievement:

  • GPU Temperature: 41-50ยฐC (low and stable)
  • No thermal throttling โ†’ sustained optimal performance

Energy Efficiency Improvement:

  • Power Consumption: 6.99kW (14% reduction)
  • Performance: 54 TFLOPS (17% improvement)
  • Energy Efficiency: 7.7 TFLOPS/kW (38% improvement)

Core Mechanisms: How Cooling Affects Energy Efficiency

  1. Thermal Throttling Prevention: Stable cooling allows GPUs to maintain peak performance continuously
  2. Power Efficiency Optimization: Eliminates inefficient power consumption caused by overheating
  3. Performance Consistency: Unstable cooling can cause GPUs to use 50% of power budget while delivering only 25% performance

Advanced cooling systems can achieve energy savings ranging from 17% to 23% compared to traditional methods. This benchmark paradoxically shows that proper cooling investment dramatically improves overall energy efficiency.

Final Summary

Unstable cooling triggers thermal throttling that simultaneously degrades LLM performance while increasing power consumption, creating a dual efficiency loss. Stable liquid cooling achieves 17% performance gains and 14% power savings simultaneously, improving energy efficiency by 38%. In AI infrastructure, adequate cooling investment is essential for optimizing both performance and energy efficiency.

With Claude

Corpus, Ontology and LLM

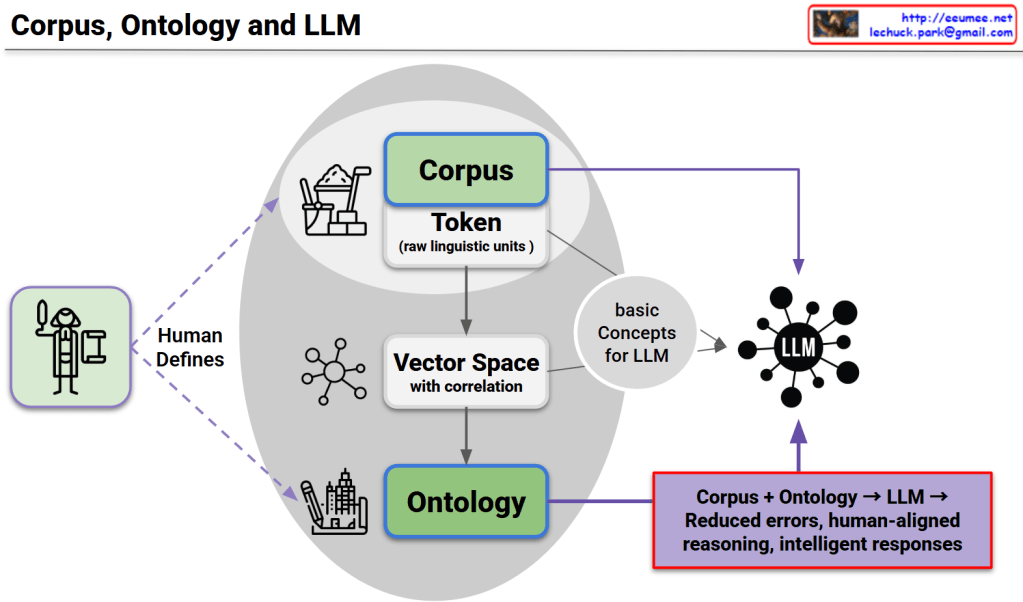
This diagram presents a unified framework consisting of three core structures, their interconnected relationships, and complementary utilization as the foundation for LLM advancement.

Three Core Structures

1. Corpus Structure

  • Token-based raw linguistic data
  • Provides statistical language patterns and usage frequency information

2. Ontology Structure

  • Systematically human-defined conceptual knowledge structure
  • Provides logical relationships and semantic hierarchies

3. LLM Structure

  • Neural network-based language processing model
  • Possesses pattern learning and generation capabilities

Interconnected Relationships and Interactions

  • Corpus โ†’ Vector Space: Numerical representation transformation of linguistic data
  • Ontology โ†’ Basic Concepts: Conceptual abstraction of structured knowledge
  • Vector Space โ†” Ontology: Mutual validation between statistical patterns and logical structures
  • Integrated Concepts โ†’ LLM: Multi-layered knowledge input

LLM Development Foundation through Complementary Relationships

Each structure compensates for the limitations of others:

  • Corpus’s statistical accuracy + Ontology’s logical consistency โ†’ Balanced knowledge foundation
  • Ontology’s explicit rules + LLM’s pattern learning โ†’ Flexible yet systematic reasoning
  • Corpus’s real-usage data + LLM’s generative capability โ†’ Natural and accurate language generation

Final Achievement

This triangular complementary structure overcomes the limitations of single approaches to achieve:

  • Error minimization
  • Human-centered reasoning capabilities
  • Intelligent and reliable response generation

This represents the core foundation for next-generation LLM development.

With Claude