DC Digitalizations with ISA-95


5-Layer Breakdown of DC Digitalization

M1: Sensing & Manipulation (ISA-95 Level 0-1)

  • Focus: Bridging physical assets with digital systems.
  • Key Activities: Ultra-fast data collection and hardware actuation.
  • Examples: High-frequency power telemetry (ms-level), precision liquid cooling control, and PTP (Precision Time Protocol) for synchronization.

M2: Monitoring & Supervision (ISA-95 Level 2)

  • Focus: Holistic visibility and IT/OT Convergence.
  • Key Activities: Correlating physical facility health (cooling/power) with IT workload performance.
  • Examples: Integrated dashboards (“Single Pane of Glass”), GPU telemetry via DCGM, and real-time anomaly detection.

M3: Manufacturing Operations Management (ISA-95 Level 3)

  • Focus: Operational efficiency and workload orchestration.
  • Key Activities: Maximizing “production” (AI output) through intelligent scheduling.
  • Examples: Topology-aware scheduling, AI-OEE (maximizing Model Flops Utilization), and predictive maintenance for assets.

M4: Business Planning & Logistics (ISA-95 Level 4)

  • Focus: Strategic planning, FinOps, and cost management.
  • Key Activities: Managing business logic, forecasting capacity, and financial tracking.
  • Examples: Per-token billing, SLA management with performance guarantees, and ROI analysis on energy procurement.

M5: AI Orchestration & Optimization (Cross-Layer)

  • Focus: Autonomous optimization (AI for AI Ops).
  • Key Activities: Using ML to predictively control infrastructure and bridge the gap between thermal inertia and dynamic loads.
  • Examples: Predictive cooling (cooling down before a heavy job starts), Digital Twins, and Carbon-aware scheduling (ESG).

Summary of Core Concepts

  • IT/OT Convergence: Integrating Information Technology (servers/software) with Operational Technology (power/cooling).
  • AI-OEE: Adapting the “Overall Equipment Effectiveness” metric from manufacturing to measure how efficiently a DC produces AI models.
  • Predictive Control: Moving from reactive monitoring to proactive, AI-driven management of power and heat.

#DataCenter #DigitalTransformation #ISA95 #AIOps #SmartFactory #ITOTConvergence #SustainableIT #GPUOrchestration #FinOps #LiquidCooling

With Gemini

MPFT: Multi-Plane Fat-Tree for Massive Scale and Cost Efficiency


MPFT: Multi-Plane Fat-Tree for Massive Scale and Cost Efficiency

1. Architecture Overview (Blue Section)

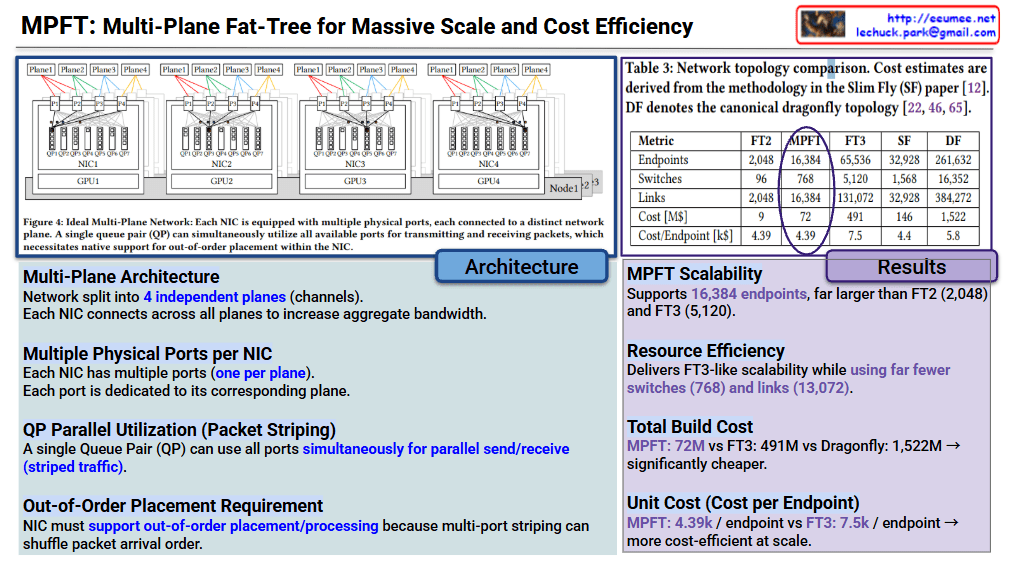
The core innovation of MPFT lies in parallelizing network traffic across multiple independent “planes” to maximize bandwidth and minimize hardware overhead.

  • Multi-Plane Architecture: The network is split into 4 independent planes (channels).
  • Multiple Physical Ports per NIC: Each Network Interface Card (NIC) is equipped with multiple ports—one for each plane.
  • QP Parallel Utilization (Packet Striping): A single Queue Pair (QP) can utilize all available ports simultaneously. This allows for striped traffic, where data is spread across all paths at once.
  • Out-of-Order Placement: Because packets travel via different planes, they may arrive in a different order than they were sent. Therefore, the NIC must natively support out-of-order processing to reassemble the data correctly.

2. Performance & Cost Results (Purple Section)

The table compares MPFT against standard topologies like FT2/FT3 (Fat-Tree), SF (Slim Fly), and DF (Dragonfly).

MetricMPFTFT3Dragonfly (DF)
Endpoints16,38465,536261,632
Switches7685,12016,352
Total Cost$72M$491M$1,522M
Cost per Endpoint$4.39k$7.5k$5.8k
  • Scalability: MPFT supports 16,384 endpoints, which is significantly higher than a standard 2-tier Fat-Tree (FT2).
  • Resource Efficiency: It achieves high scalability while using far fewer switches (768) and links compared to the 3-tier Fat-Tree (FT3).
  • Economic Advantage: At $4.39k per endpoint, it is one of the most cost-efficient models for large-scale data centers, especially when compared to the $7.5k cost of FT3.

Summary

MPFT is presented as a “sweet spot” solution for AI/HPC clusters. It provides the high-speed performance of complex 3-tier networks but keeps the cost and hardware complexity closer to simpler 2-tier systems by using multi-port NICs and traffic striping.


#NetworkArchitecture #DataCenter #HighPerformanceComputing #GPU #AITraining #MultiPlaneFatTree #MPFT #NetworkingTech #ClusterComputing #CloudInfrastructure

“End-to-End AI Factory Optimization: From Infrastructure to SLA


End-to-End AI Factory Optimization: Bridging Infrastructure and Business Value

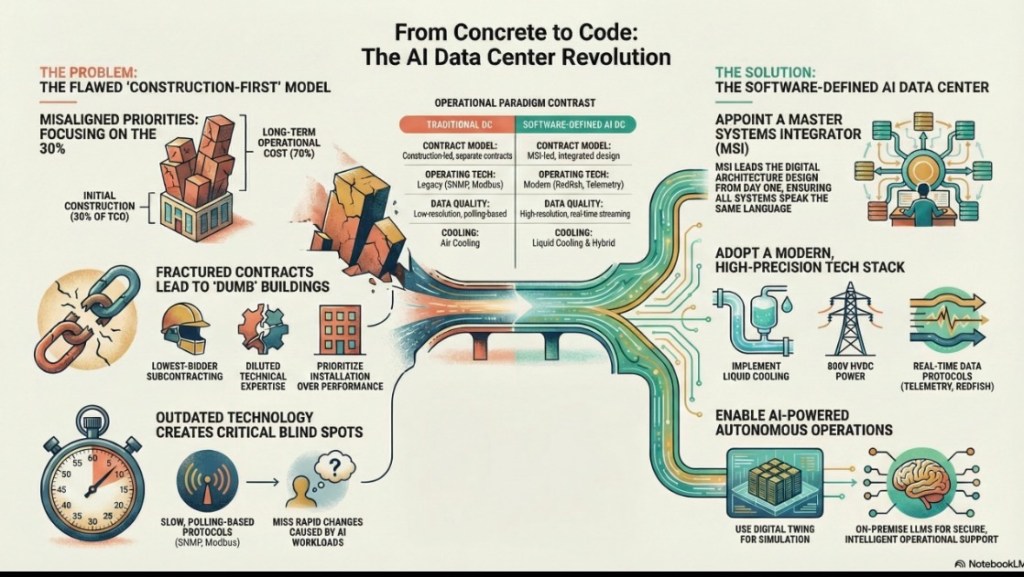
This diagram outlines a comprehensive framework for optimizing an “AI Factory”—a modern data center dedicated to AI workloads. The core message is that optimizing AI performance and cost requires a holistic view that connects physical infrastructure realities directly to high-level business Service Level Agreements (SLAs).

Here is a breakdown of the three main pillars of this framework:

1. The AI Factory (Infrastructure Foundation)

On the far left, we see the AI Factory itself. This represents the converged physical infrastructure required to run massive AI models (indicated by the neural network icons).

It emphasizes that the critical hardware components—GPUs (Compute), Networking, Power, and Cooling—cannot be managed in silos. They are marked as “ULTRA CONNECTED,” meaning the behavior of one directly impacts the others (e.g., intense GPU activity spikes power demand and generates immediate heat, requiring instant cooling response).

2. Ultra Data Quality (The Intelligence Layer)

In the center, the diagram highlights the necessity of Ultra Data Quality. To optimize such a complex, interconnected system, standard logging isn’t enough. The telemetry data collected from the infrastructure must meet three critical criteria:

  • Ultra Precision & Resolution: Capturing minute details of operations.
  • Ultra Time-Sync: The ability to perfectly synchronize timestamps across different hardware types (e.g., nanosecond-level GPU events vs. millisecond-level cooling events) to understand cause-and-effect relationships accurately.

3. Cost & SLA vs. Usage+Performance (The Value Realization)

The right section is the most critical, showing the direct mapping between physical operational metrics (Usage+Performance) and business outcomes (Cost & SLA). It argues that physical stability directly dictates business success:

  • TOKEN (Output/Revenue) ↔ Clock Consistency: To maintain a steady stream of AI output (tokens), the GPU clock speeds must remain consistent and stable without fluctuating.
  • FLOPS (Peak Compute Power) ↔ Zero Throttling Events: Achieving maximum floating-point operations per second requires eliminating “throttling”—performance downgrades caused by overheating or power constraints.
  • Watt (Operational Cost) ↔ Power Draw vs TDP: Managing operational expenses (electricity bills) requires optimizing the actual power draw relative to the hardware’s Thermal Design Power (TDP) limits.
  • PUE (Data Center Efficiency) ↔ Thermal Headroom: The overall Power Usage Effectiveness of the facility depends on optimizing “thermal headroom”—managing how close the cooling systems run to their limits without wasting energy.

This diagram illustrates that optimizing an AI business isn’t just about better code or faster chips; it requires an end-to-end approach where the physical realities of power, cooling, and hardware are tightly integrated with data analytics to ensure performance promises (SLAs) are met cost-effectively.


#AIFactory #DataCenterOptimization #AIInfrastructure #GPUComputing #SLAmanagement #EnergyEfficiency #PUE #Operations #TechInnovation #ArtificialIntelligence

Predictive Count/Resolve Time for .


the “Predictive Count/Resolve Time” Diagram

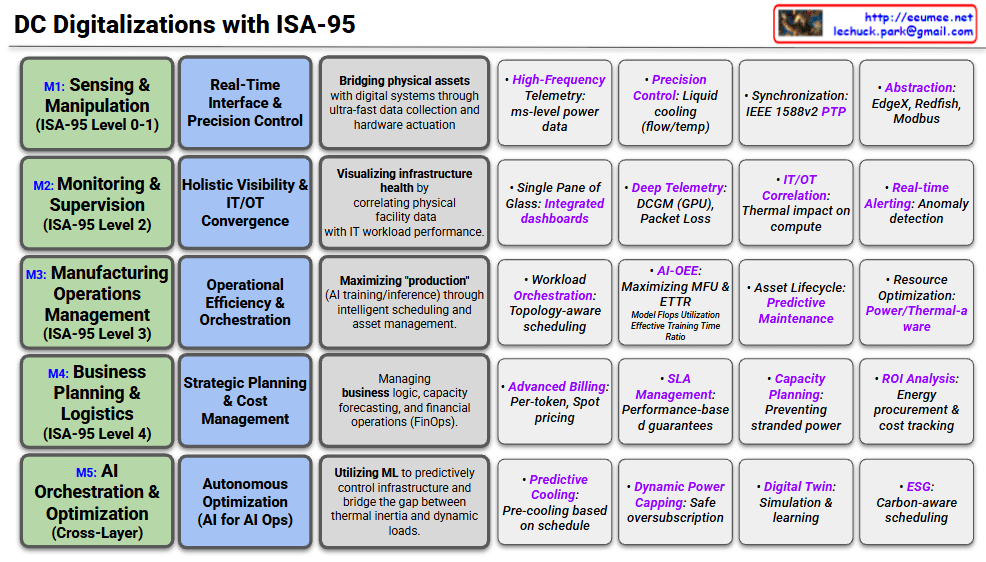
This diagram illustrates the workflow of IT Operations or System Maintenance, specifically comparing Predictive Maintenance (Proactive) versus Recovery/Reactive (Reactive) processes.

It is divided into two main flows: the Preventive Flow (Left) and the Reactive Flow (Right).

1. Left Flow: Predictive Maintenance

This represents the ideal process where anomalies are detected and addressed before a full system failure occurs.

  • Process:
    • Work Changes / Monitoring: Routine operations and continuous system monitoring.
    • Anomaly: The system exhibits abnormal patterns, but it hasn’t failed yet.
    • Detection (Awareness): Monitoring tools or operators detect this anomaly.
    • Predictive Maintenance: Maintenance is performed proactively to prevent the fault.
  • Key Performance Indicators (KPIs):
    • Count: The number of times predictive maintenance was performed.
    • PTM Success Rate: A metric to measure success (e.g., considered successful if no disability/failure occurs within 14 days after the predictive maintenance).

2. Right Flow: Reactive Recovery

This is the response process when an anomaly is missed, leading to an actual system failure.

  • Process:
    • Abnormal → Alert: The condition worsens, triggering an alert. The time taken to reach this point is MTTD (Mean Time To Detect).
    • Fault Down: The system actually fails or goes down.
    • Propagation Time (to Experts): The time it takes to escalate the issue to the right experts. This relates to MTTE (Mean Time To Engage Expert).
    • Recovery Time: The time taken by experts to fix the issue.
  • Key Performance Indicators (KPIs):
    • MTTR (Mean Time To Resolve/Repair): The total time from the failure (Fault Down) until the system is fully recovered. Reducing this time is a critical operational goal.

3. Summary & Key Takeaway

The diagram visually emphasizes the importance of “preventing issues before they happen (Left)” rather than “fixing them after they break (Right).”

  • Flow Logic: If an ‘Anomaly’ is successfully ‘Detected’, it leads to ‘Predictive Maintenance’. If missed, it escalates to ‘Abnormal’ and results in a ‘Fault Down’.
  • Goal: The objective is to minimize MTTR (downtime) on the right side and increase the PTM Count (proactive prevention) on the left side to ensure high system availability.

#DevOps #SRE #PredictiveMaintenance #MTTR #IncidentManagement #ITOperations #SystemMonitoring #DisasterRecovery #MTTD #TechMaintenance

With Gemini