AI Infrastructure Architect & Technical Visualizer "Complex Systems, Simplified. I translate massive AI infrastructure into visual intelligence." I love to learn computer tech and help people by the digital.
From Claude with some prompting This image is an infographic explaining the concept of data quality. It shows the flow of data from a facility or source, going through various stages of power consumption like generating, medium, converting, network, and computing power. The goal is to ensure reliable data with good performance and high resolution for optimal analysis and better insights represented by icons and graphs.
The key aspects highlighted are:
Data origin at a facility
Different power requirements at each data stage (generating, medium, converting, network, computing)
Desired qualities of reliable data, good performance, high resolution
End goal of collecting/analyzing data for better insights
The infographic uses a combination of text labels, icons, and diagrams to illustrate the data quality journey from source to valuable analytical output in a visually appealing manner.
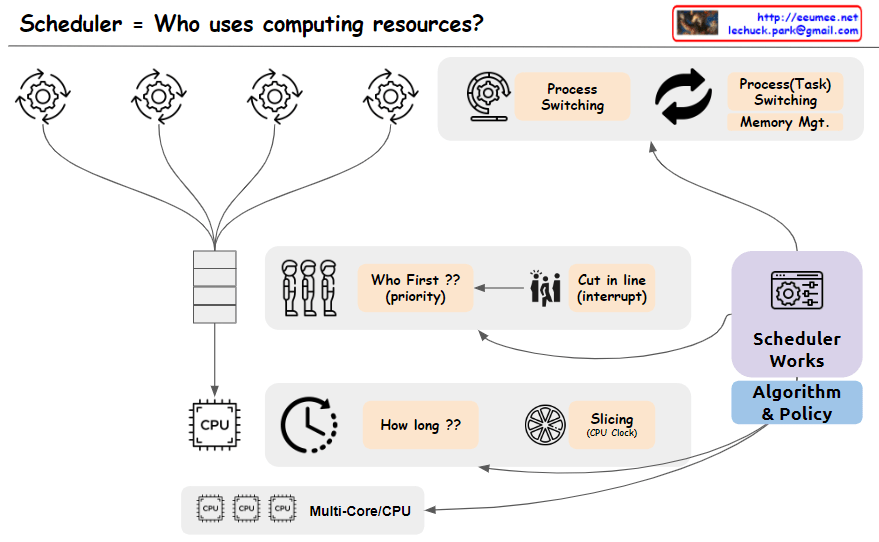
From Claude with some prompting The image depicts a scheduler system that manages the allocation of computing resources, addressing the key question “Who uses computing resources?”. The main components shown are:
Multiple processes or tasks are represented by circular icons, indicating entities requesting computing resources.
A “Who First?? (priority)” block that determines the order or priority in which tasks will be serviced.
A “Cut in Line (Interrupt)” block, suggests that certain tasks may be able to interrupt or take precedence over others.
A CPU block represents the computing resources being scheduled.
A “How long??” block, likely referring to the scheduling algorithm determining how long each task will be allocated CPU time.
A “Slicing (Job Qsec)” block, which could be related to time slicing or dividing CPU time among tasks.
Process switching and task switching blocks indicate the ability to switch between processes or tasks when scheduling CPU time.
An “Algorithm & Policy” block, representing the scheduling algorithms and policies used by the scheduler.
A “Multi-Core/CPU” block, explicitly showing support for multi-core or multi-CPU systems.
The image effectively covers the key concepts and components involved in scheduling computing resources, including task prioritization, interrupts, CPU time allocation, time slicing, process/task switching, scheduling algorithms and policies, and support for multi-core/multi-CPU systems. Memory management is assumed to be part of the task-switching process and is not explicitly depicted.
From Claude with some prompting This diagram illustrates various fine-tuning techniques to improve the performance of large language models.
At the center, there is a Tuning Module connected to an Inference Module (for generating answers). The Tuning Module is linked to the Weight DataBase (Parameter), indicating that it fine-tunes the weights and parameters of the model.
On the left, there are Knowledge Base and Vector DataBase, which store the model’s knowledge and data.
In the top right, the RAG (Retrieval Augmented Generation) block retrieves relevant information from Domain Specific External Sources to augment the generation process.
The Prompt Engineering block involves Prompt Tuning to generate massive prompts with expert knowledge.
At the bottom, various parameter-efficient fine-tuning techniques are presented, such as PEFT, Fine Tuning, Bias Fine Tuning, Prefix Tuning, Adapter, and LoRA.
Regarding Prefix Tuning, the description “Attach a virtual prefix sequence” suggests that it involves adding virtual prompt tokens at the beginning of the input sequence.
Overall, this diagram comprehensively illustrates the integration of knowledge, prompt engineering, and diverse fine-tuning methods for enhancing large language models’ performance across various domains.
From Claude with some prompting The image explains the two main modes of Reverse Path Forwarding (RPF): Strict RPF and Loose RPF.
At the top left, three hosts are sending packets to a router. The router is determining which port to use for forwarding based on the source IP address during the routing process.
The top right explains the operation of Strict RPF. In Strict RPF, all packets are validated. It compares the port used for routing the source IP with the actual receiving port, and allows the packet only if they match.
The note under Strict RPF mentions that it prevents “No Looping (primarily for multicast)” and “No Spoofing (primarily for unicast)”. Both Strict RPF and Loose RPF can help prevent looping and spoofing to some extent.
No Looping is primarily important for multicast routing. RPF is used in multicast protocols to prevent packet loops. Both Strict RPF and Loose RPF aid in loop prevention.
No Spoofing is primarily related to security issues with unicast IP traffic. IP spoofing involves an attacker using a forged source IP address to launch network attacks. Both Strict RPF and Loose RPF are effective in mitigating IP spoofing attacks.
The bottom right explains Loose RPF. In Loose RPF, an RPF interface list for the source address is configured for each port. If the receiving port is in the RPF list for that source IP, the packet is allowed.
Therefore, while Strict RPF provides more comprehensive packet checking, Loose RPF can also help prevent looping (mainly in multicast) and spoofing (mainly in unicast) by referring to the pre-configured RPF interface lists for each port and source address.
From Claude with some prompting The image provides a comprehensive overview of the key components and infrastructure required for an AI data center. At the core lies the high computing power, facilitated by cutting-edge CPUs, GPUs, large memory capacity, and high-speed interconnects for parallel and fast data processing.
However, the intense computational demands of AI workloads generate significant heat, which the image highlights as a critical challenge. To address this, the diagram depicts the transition from traditional air cooling to liquid cooling systems, which are better equipped to handle the high heat dissipation and thermal management needs of AI hardware.
The image also emphasizes the importance of power management and “green computing” initiatives, aiming to make the data center operations more energy-efficient and environmentally sustainable, given the substantial power requirements of AI systems.
Additionally, the diagram recognizes the complexity of managing and orchestrating such a large-scale AI infrastructure, advocating for AI-driven management systems to intelligently monitor, optimize, and automate various aspects of the data center operations, including power, cooling, servers, and networking.
Furthermore, the image touches upon the need for robust security measures, with the concept of a “Secured Cloud Service” depicted, ensuring data privacy and protection for AI applications and services hosted in the data center.
Overall, the image presents a holistic view of an AI data center, highlighting the symbiotic relationship between high-performance computing hardware, advanced cooling solutions like liquid cooling, power management, AI-driven orchestration, and robust security measures – all working in tandem to support cutting-edge AI applications and services effectively and efficiently.
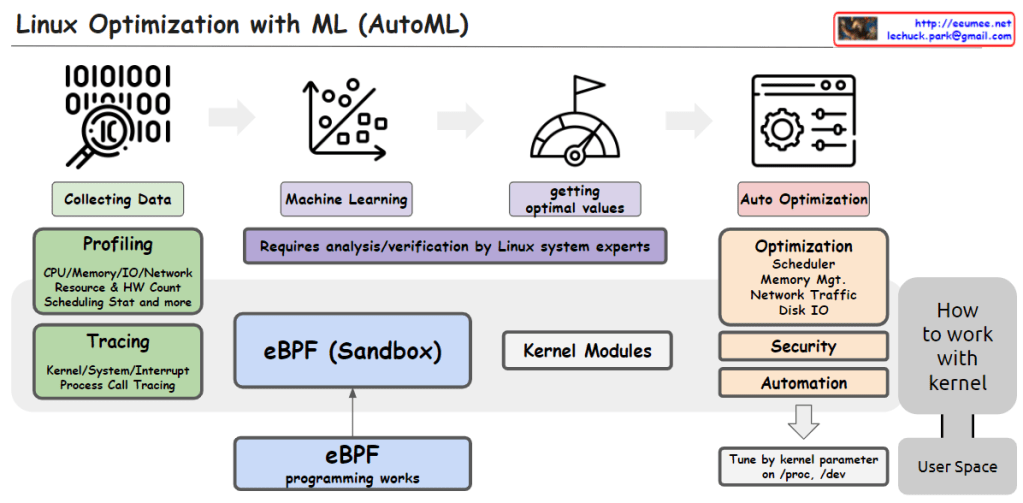
From Claude with some prompting This image illustrates the process of utilizing Machine Learning (ML) and AutoML techniques for system optimization in Linux.
It starts with collecting data through profiling techniques that gather statistics on CPU, memory, I/O, network resource usage, hardware counters, scheduling information, etc. Tracing is also employed to capture kernel/system/interrupt events and process call traces.
The collected data is then used to train machine learning models. This step requires analysis and verification by Linux system experts.
The trained models help determine optimal values, which are then applied to optimize various system components such as the scheduler, memory management, network traffic, and disk I/O. Optimization can also target security and automation aspects.
The eBPF (Enhanced Berkeley Packet Filter) sandbox, situated in the center, allows safe execution within the kernel, enabling eBPF programs to interact with the kernel.
Kernel modules provide another way to implement optimization logic and integrate it directly into the kernel.
Finally, kernel parameters can be tuned from user space to perform optimizations.
In summary, the image depicts an AutoML-based process that leverages data collection, machine learning modeling, deriving optimal values, eBPF, kernel modules, and parameter tuning to automate system optimization in Linux across various kernel subsystems like the scheduler, memory management, network, and disk I/O.C
From Claude with some prompting This image depicts a high-level overview of a foundation model architecture. It consists of various components including a knowledge base, weight database (parameters), vector database (relative data), tuning module for making answers, inference module for generating answers, prompt tools, and an evaluation component for benchmarking.
The knowledge base stores structured information, while the weight and vector databases hold learnable parameters and relative data representations, respectively. The tuning and inference modules utilize these components to generate responses or make predictions. Prompt tools assist in forming inputs, and the evaluation component assesses the model’s performance.
This architectural diagram illustrates the core building blocks and data flow of a foundation model system, likely used for language modeling, knowledge representation, or other AI applications that require integrating diverse data sources and capabilities.