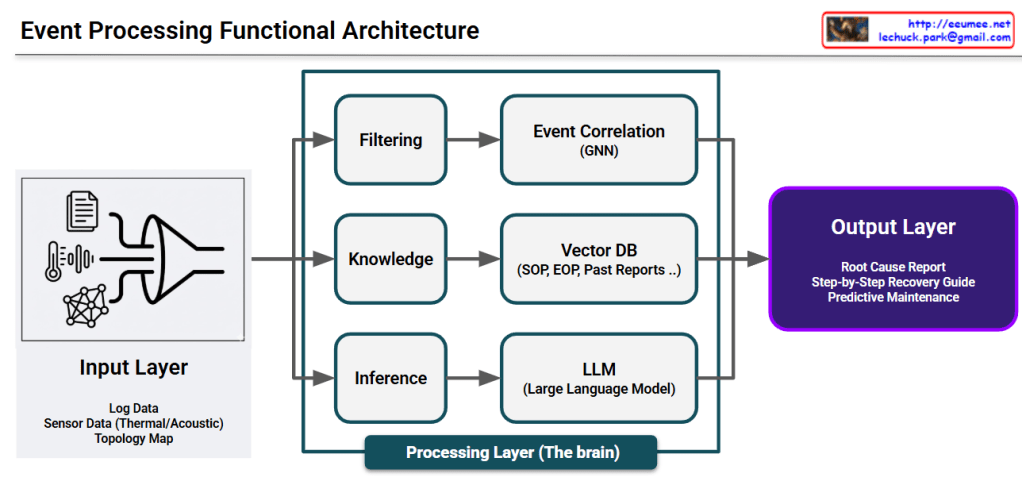
This image illustrates a Data Processing Pipeline (Architecture) where raw data is ingested, analyzed through an AI engine, and converted into actionable business intelligence.
## Image Interpretation: AI-Driven Data Pipeline
### 1. Input Layer (Left: Data Ingestion)
This represents the raw data collected from various sources within the infrastructure:
Log Data (Document Icon): System logs and event records that capture operational history.
Sensor Data (Thermometer & Waveform Icons): Real-time monitoring of physical environments, specifically focusing on Thermal (heat) and Acoustic (noise) patterns.
Topology Map (Network Icon): The structural map of equipment and their interconnections, providing context for how data flows through the system.
### 2. Integration & Processing (Center: The AI Funnel)
The Funnel/Pipe Shape: This symbolizes the process of data fusion and refinement. It represents different data types being standardized and processed through an AI model or analytics engine to filter out noise and identify patterns.
### 3. Output Layer (Right: Actionable Insights)
The final results generated by the analysis, designed to provide immediate value to operators:
Root Cause Report (Document with Magnifying Glass): Identifies the underlying reason for a specific failure or anomaly.
Step-by-Step Recovery Guide (Checklist with Arrows): Provides a sequential, automated, or manual procedure to restore the system to a healthy state.
Predictive Maintenance (Gear with Upward Arrow): Utilizes historical trends to predict potential failures before they occur, optimizing maintenance schedules and reducing downtime.
# Summary
The diagram effectively visualizes the transition from complex raw data to actionable intelligence. It highlights the core value of an AI-driven platform: reducing cognitive load for human operators by providing clear, data-backed directions for maintenance and recovery.
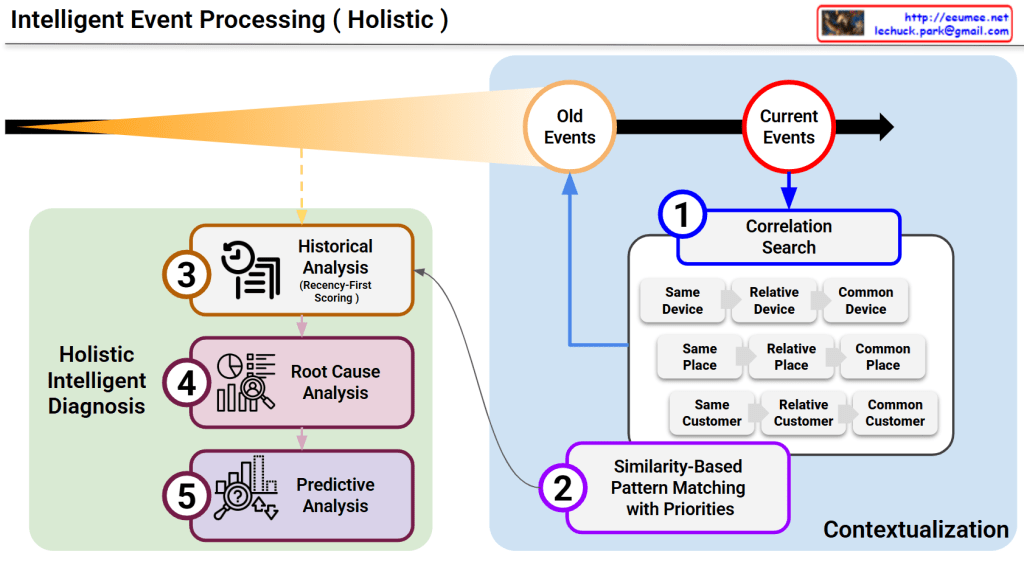
This diagram illustrates a sophisticated framework for Intelligent Event Processing, designed to provide a comprehensive, multi-layered diagnosis of system events. It moves beyond simple alerts by integrating historical context, spatial correlations, and future projections.
1. The Principle of Recency-First Scoring (Top Section)
The orange cone expanding toward the Current Events represents the Time-Decay or Recency-First Scoring model.
Weighted Importance: While “Old Events” are maintained for context, the system assigns significantly higher weight to the most recent data.
Sensitivity: This ensures the AI remains highly sensitive to emerging trends and immediate anomalies while naturally phasing out obsolete patterns.
2. Multi-Dimensional Correlation Search (Box 1)
When a current event is detected, the system immediately executes a Correlation Search across three primary dimensions to establish a spatial and logical context:
Device Context: Investigates if the issue is isolated to the same device, related devices, or common device types.
Spatial Context (Place): Analyzes if the event is tied to a specific location, a relative area (e.g., the same rack), or a common facility environment.
Customer Context: Checks for patterns across the same customer, relative accounts, or common customer profiles.
3. Similarity-Based Pattern Matching (Box 2)
By combining the results of the Correlation Search with the library of “Old Events,” the system performs Pattern Matching with Priorities.
This step identifies historical precedents that most closely resemble the current event’s “fingerprint.”
It functions similarly to Case-Based Reasoning (CBR), leveraging past solutions to address present challenges.
4. Holistic Intelligent Diagnosis (Green Box)
This is the core engine where three distinct analytical disciplines converge to create an actionable output:
③ Historical Analysis: Utilizes the recency-weighted scores to understand the evolution of the current issue.
④ Root Cause Analysis (RCA): Drills down into the underlying triggers to identify the “why” behind the event.
⑤ Predictive Analysis: Projects the likely future trajectory of the event, allowing for proactive rather than reactive management.
Summary
For the platform, this diagram serves as the “brain” of the operation. It demonstrates how the agent doesn’t just see a single data point, but rather a “Holistic” picture that connects the dots across time, space, and causality.
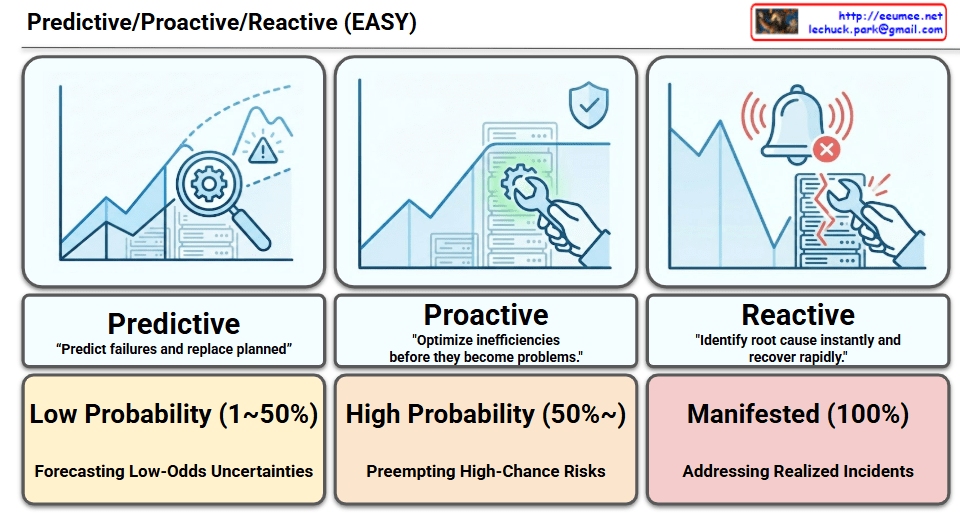
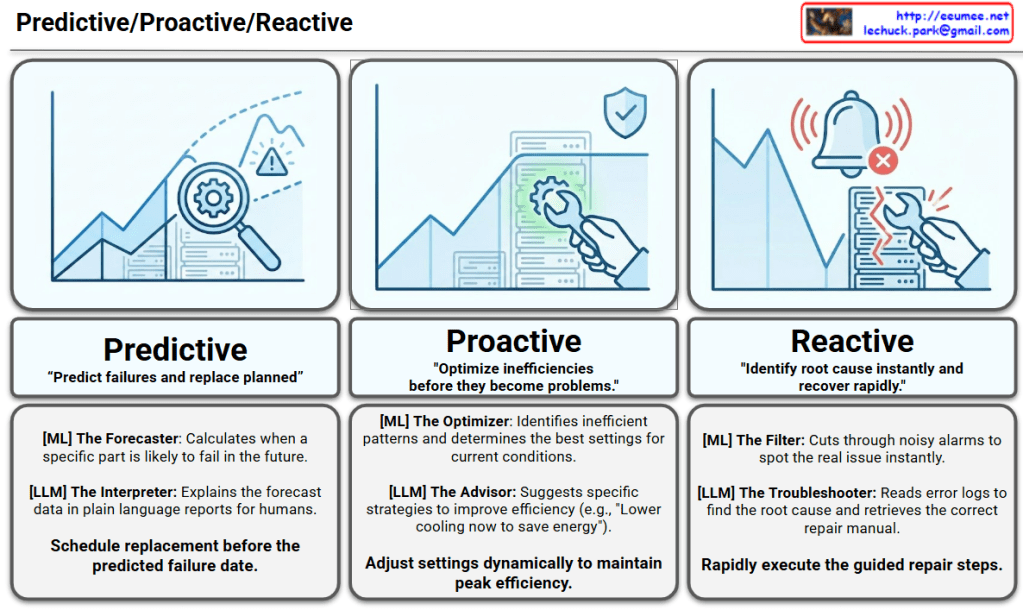
The infographic visualizes how AI technologies (Machine Learning and Large Language Models) are applied across Predictive, Proactive, and Reactive stages of facility management.
1. Predictive Stage
This is the most advanced stage, anticipating future issues before they occur.
Core Goal: “Predict failures and replace planned.”
Icon Interpretation: A magnifying glass is used to examine a future point on a rising graph, identifying potential risks (peaks and warnings) ahead of time.
Role of AI:
[ML] The Forecaster: Analyzes historical data to calculate precisely when a specific component is likely to fail in the future.
[LLM] The Interpreter: Translates complex forecast data and probabilities into plain language reports that are easy for human operators to understand.
Key Activity: Scheduling parts replacement and maintenance windows well before the predicted failure date.
2. Proactive Stage
This stage focuses on optimizing current conditions to prevent problems from developing.
Core Goal: “Optimize inefficiencies before they become problems.”
Icon Interpretation: On a stable graph, a wrench is shown gently fine-tuning the system for optimization, protected by a shield icon representing preventative measures.
Role of AI:
[ML] The Optimizer: Identifies inefficient operational patterns and determines the optimal configurations for current environmental conditions.
[LLM] The Advisor: Suggests specific, actionable strategies to improve efficiency (e.g., “Lower cooling now to save energy”).
Key Activity: Dynamically adjusting system settings in real-time to maintain peak efficiency.
3. Reactive Stage
This stage deals with responding rapidly and accurately to incidents that have already occurred.
Core Goal: “Identify root cause instantly and recover rapidly.”
Icon Interpretation: A sharp drop in the graph accompanied by emergency alarms, showing an urgent repair being performed on a broken server rack.
Role of AI:
[ML] The Filter: Cuts through the noise of massive alarm volumes to instantly isolate the true, critical issue.
[LLM] The Troubleshooter: Reads and analyzes complex error logs to determine the root cause and retrieves the correct Standard Operating Procedure (SOP) or manual.
Key Activity: Rapidly executing the guided repair steps provided by the system.
Summary
The image illustrates the evolution of data center operations from traditional Reactive responses to intelligent Proactive optimization and Predictive maintenance.
It clearly delineates the roles of AI, where Machine Learning (ML) handles data analysis and forecasting, while Large Language Models (LLMs) interpret these insights and provide actionable guidance.
Ultimately, this integrated AI approach aims to maximize uptime, enhance energy efficiency, and accelerate incident recovery in critical infrastructure.
This diagram illustrates the workflow of IT Operations or System Maintenance, specifically comparing Predictive Maintenance (Proactive) versus Recovery/Reactive (Reactive) processes.
It is divided into two main flows: the Preventive Flow (Left) and the Reactive Flow (Right).
1. Left Flow: Predictive Maintenance
This represents the ideal process where anomalies are detected and addressed before a full system failure occurs.
Process:
Work Changes / Monitoring: Routine operations and continuous system monitoring.
Anomaly: The system exhibits abnormal patterns, but it hasn’t failed yet.
Detection (Awareness): Monitoring tools or operators detect this anomaly.
Predictive Maintenance: Maintenance is performed proactively to prevent the fault.
Key Performance Indicators (KPIs):
Count: The number of times predictive maintenance was performed.
PTM Success Rate: A metric to measure success (e.g., considered successful if no disability/failure occurs within 14 days after the predictive maintenance).
2. Right Flow: Reactive Recovery
This is the response process when an anomaly is missed, leading to an actual system failure.
Process:
Abnormal → Alert: The condition worsens, triggering an alert. The time taken to reach this point is MTTD (Mean Time To Detect).
Fault Down: The system actually fails or goes down.
Propagation Time (to Experts): The time it takes to escalate the issue to the right experts. This relates to MTTE (Mean Time To Engage Expert).
Recovery Time: The time taken by experts to fix the issue.
Key Performance Indicators (KPIs):
MTTR (Mean Time To Resolve/Repair): The total time from the failure (Fault Down) until the system is fully recovered. Reducing this time is a critical operational goal.
3. Summary & Key Takeaway
The diagram visually emphasizes the importance of “preventing issues before they happen (Left)” rather than “fixing them after they break (Right).”
Flow Logic: If an ‘Anomaly’ is successfully ‘Detected’, it leads to ‘Predictive Maintenance’. If missed, it escalates to ‘Abnormal’ and results in a ‘Fault Down’.
Goal: The objective is to minimize MTTR (downtime) on the right side and increase the PTM Count (proactive prevention) on the left side to ensure high system availability.