Massive simple parallel computing

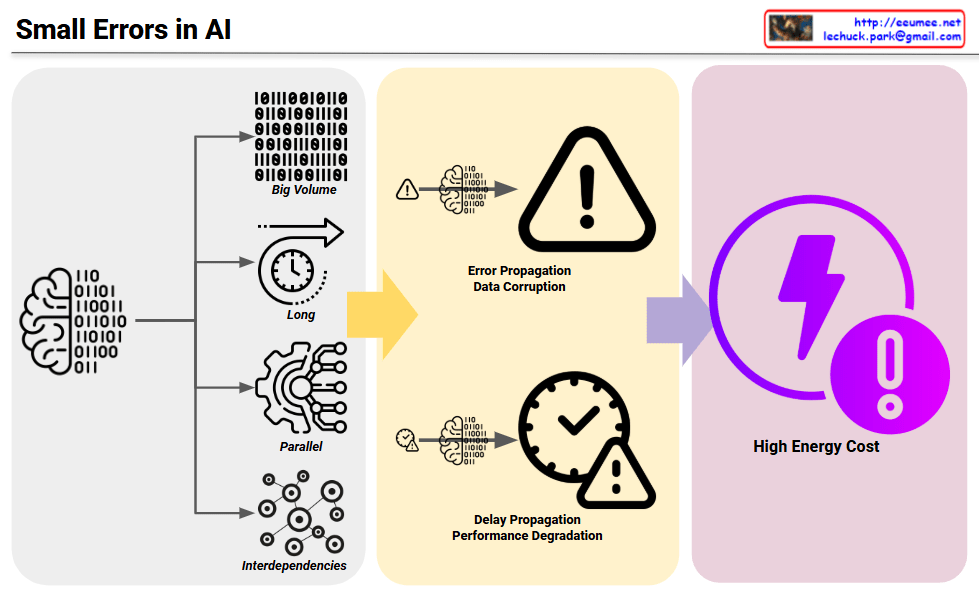
This diagram presents a systematic framework that defines the essence of AI LLMs as “Massive Simple Parallel Computing” and systematically outlines the resulting issues and challenges that need to be addressed.

Core Definition of AI LLM: “Massive Simple Parallel Computing”

Massive: Enormous scale with billions of parameters Simple: Fundamentally simple computational operations (matrix multiplications, etc.) Parallel: Architecture capable of simultaneous parallel processing Computing: All of this implemented through computational processes

Core Issues Arising from This Essential Nature

Big Issues:

  • Black-box unexplainable: Incomprehensibility due to massive and complex interactions
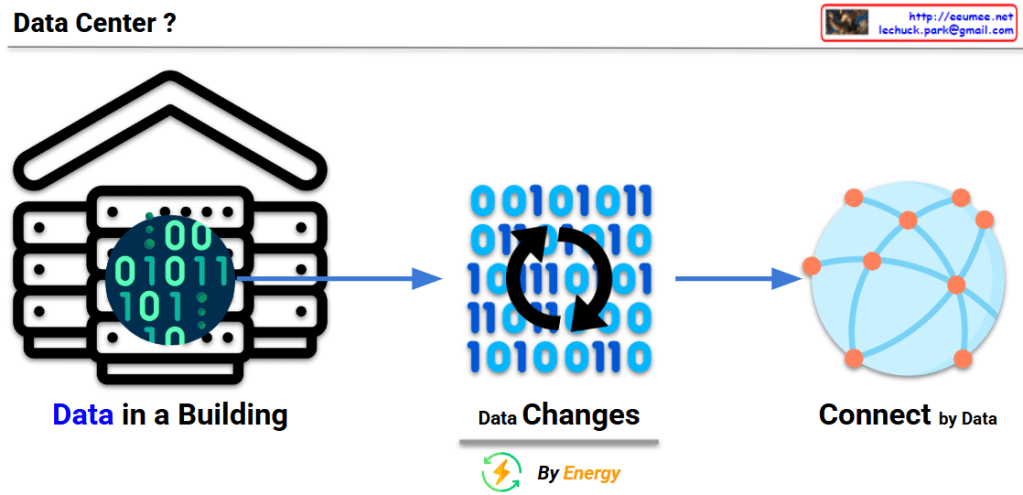
  • Energy-intensive: Enormous energy consumption inevitably arising from massive parallel computing

Essential Requirements Therefore Needed

Very Required:

  • Verification: Methods to ensure reliability of results given the black-box characteristics
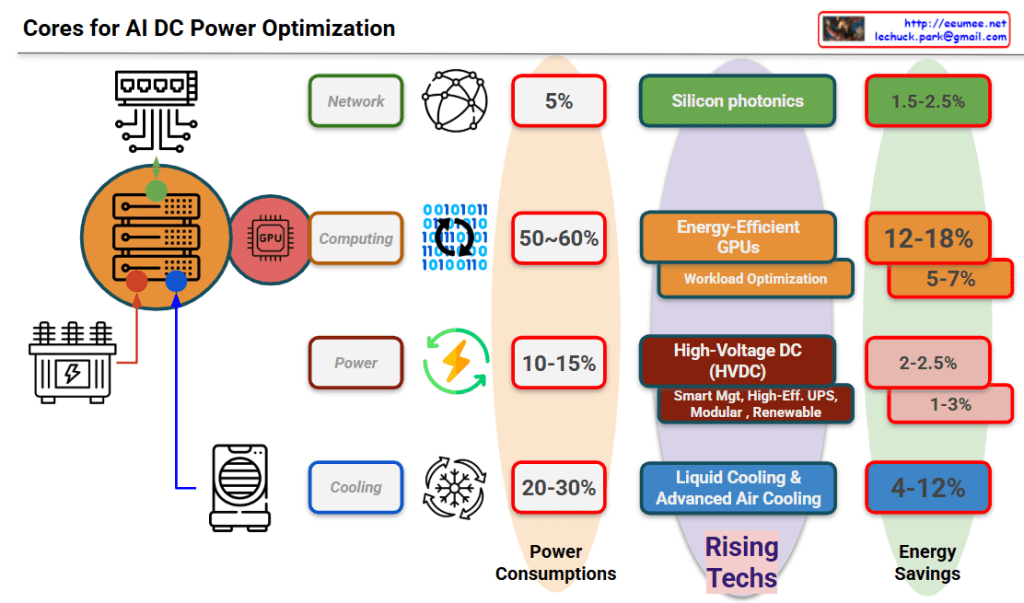
  • Optimization: Approaches to simultaneously improve energy efficiency and performance

The Ultimate Question: “By What?”

How can we solve all these requirements?

In other words, this framework poses the fundamental question about specific solutions and approaches to overcome the problems inherent in the essential characteristics of current LLMs. This represents a compressed framework showing the core challenges for next-generation AI technology development.

The diagram effectively illustrates how the defining characteristics of LLMs directly lead to significant challenges, which in turn demand specific capabilities, ultimately raising the critical question of implementation methodology.

With Claude

AI Core Internals (1+4)

This image is a diagram titled “AI Core Internals (1+4)” that illustrates the core components of an AI system and their interconnected relationships.

The diagram contains 5 main components:

  1. Data – Located in the top left, represented by database and document icons.
  2. Hardware Infra – Positioned in the top center, depicted with a CPU/chipset icon with radiating connections.
  3. Foundation(AI) Model – Located in the top right, shown as an AI network node with multiple connection points.
  4. Energy Infra – Positioned at the bottom, represented by wind turbine and solar panel icons.
  5. User Group – On the far right, depicted as a collection of diverse people icons in various colors.

The arrows show the flow and connections between components:

  • From Data to Hardware Infrastructure
  • From Hardware Infrastructure to the AI Model
  • From the AI Model to end users
  • From Energy Infrastructure to Hardware Infrastructure (power supply)

This diagram visually explains how modern AI systems integrate data, computing hardware, AI models, and energy infrastructure to deliver services to end users. It effectively demonstrates the interdependent ecosystem required for AI operations, highlighting both the technical components (data, hardware, models) and the supporting infrastructure (energy) needed to serve diverse user communities.

With Claude

Small Errors in AI

Four Core Characteristics of AI Tasks (Left)

AI systems have distinctive characteristics that make them particularly vulnerable to error amplification:

  • Big Volume: Processing massive amounts of data
  • Long Duration: Extended computational operations over time
  • Parallel Processing: Simultaneous execution of multiple tasks
  • Interdependencies: Complex interconnections where components influence each other

Small Error Amplification (Middle)

Due to these AI characteristics, small initial errors become amplified in two critical ways:

  • Error Propagation & Data Corruption: Minor errors spread throughout the system, significantly impacting overall data quality
  • Delay Propagation & Performance Degradation: Small delays accumulate and cascade, severely affecting entire system performance

Final Impact (Right)

  • Very High Energy Cost: Errors and performance degradation result in exponentially higher energy consumption than anticipated

Key Message

The four inherent characteristics of AI (big volume, long duration, parallel processing, and interdependencies) create a perfect storm where small errors can amplify exponentially, ultimately leading to enormously high energy costs. This diagram serves as a warning about the critical importance of preventing small errors in AI systems before they cascade into major problems.

With Claude

AI DC Energy Optimization

Core Technologies for AI DC Power Optimization

This diagram systematically illustrates the core technologies for AI datacenter power optimization, showing power consumption breakdown by category and energy savings potential of emerging technologies.

Power Consumption Distribution:

  • Network: 5% – Data transmission and communication infrastructure
  • Computing: 50-60% – GPUs and server processing units (highest consumption sector)
  • Power: 10-15% – UPS, power conversion and distribution systems
  • Cooling: 20-30% – Server and equipment temperature management systems

Energy Savings by Rising Technologies:

  1. Silicon Photonics: 1.5-2.5% – Optical communication technology improving network power efficiency
  2. Energy-Efficient GPUs & Workload Optimization: 12-18% (5-7%) – AI computation optimization
  3. High-Voltage DC (HVDC): 2-2.5% (1-3%) – Smart management, high-efficiency UPS, modular, renewable energy integration
  4. Liquid Cooling & Advanced Air Cooling: 4-12% – Cooling system efficiency improvements

This framework presents an integrated approach to maximizing power efficiency in AI datacenters, addressing all major power consumption areas through targeted technological solutions.

With Claude

Data Center

This image explains the fundamental concept and function of a data center:

  1. Left: “Data in a Building” – Illustrates a data center as a physical building that houses digital data (represented by binary code of 0s and 1s).
  2. Center: “Data Changes” – With the caption “By Energy,” showing how data is processed and transformed through the consumption of energy.
  3. Right: “Connect by Data” – Demonstrates how processed data from the data center connects to the outside world, particularly the internet, forming networks.

This diagram visualizes the essential definition of a data center – a physical building that stores data, consumes energy to process that data, and plays a crucial role in connecting this data to the external world through the internet.

With Claude

There’s such thing as ‘impossible’.

This infographic illustrates a software development philosophy titled “There’s such thing as ‘impossible’.” It emphasizes that there are real limitations in development:

  1. Development process flow:
    • “Machine Code” (represented by binary digits)
    • “Software Dev” (showing code editor)
    • “Application” (showing mobile interface)
    • Arrow pointing to infinity symbol labeled “Unbounded” with a warning sign
  2. Practical constraints:
    • “Reality has no ∞ button. Choose.” (emphasizing limitations exist)
    • Icons representing people and money (resource management)
    • “Everything requires a load” (showing resources are needed)
    • “Energy” and “Time” with cycling arrows (demonstrating finite resources)
  3. Keys to successful development:
    • Clear problem definition (“Clear Definition”)
    • Setting priorities (“Priorities”)
    • Target goals

The overall message highlights that impossibility does exist in software development due to real-world constraints of time, energy, and resources. It emphasizes the importance of acknowledging these limitations and addressing them through clear problem definition and priority setting for effective development.

With Claude

Rule-Based vs LLM AI

Rule-Based AI vs. Machine Learning: Finding the Fastest Hiking Route

Rule-Based AI

  • A single expert hiker analyzes a map, considering terrain and conditions to select the optimal route.
  • This method is efficient and requires minimal energy (a small number of lunchboxes).

Machine Learning

  • A large number of hikers explore all possible paths without prior knowledge.
  • The fastest hiker’s route is chosen as the optimal path.
  • This approach requires many attempts, consuming significantly more energy (a vast number of lunchboxes).

👉 Comparison Summary

  • Rule-Based AI: Finds the best route through analysis → Efficient, low energy consumption
  • Machine Learning: Finds the best route through trial and error → Inefficient but discovers optimal paths, high energy consumption

with ChatGPT