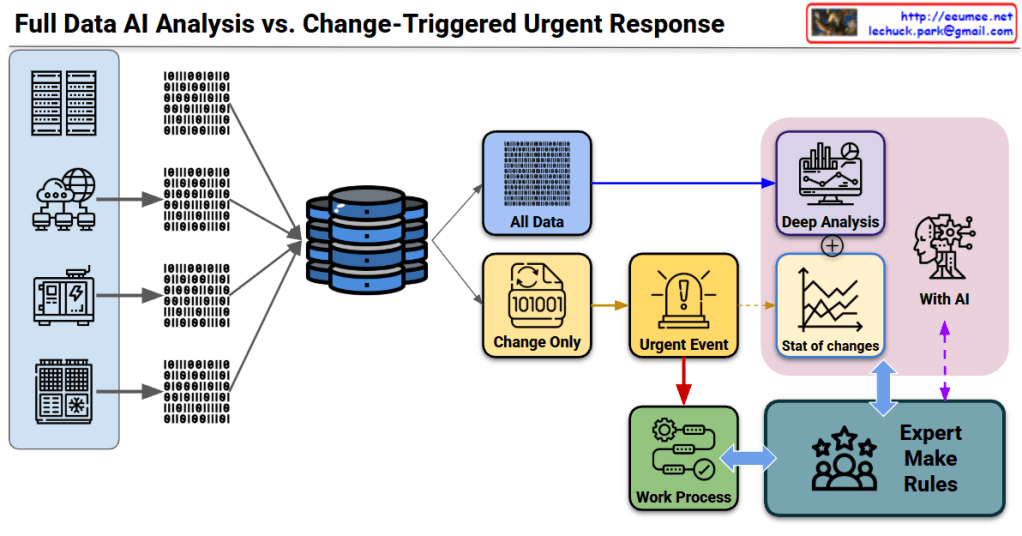
Architecture Overview
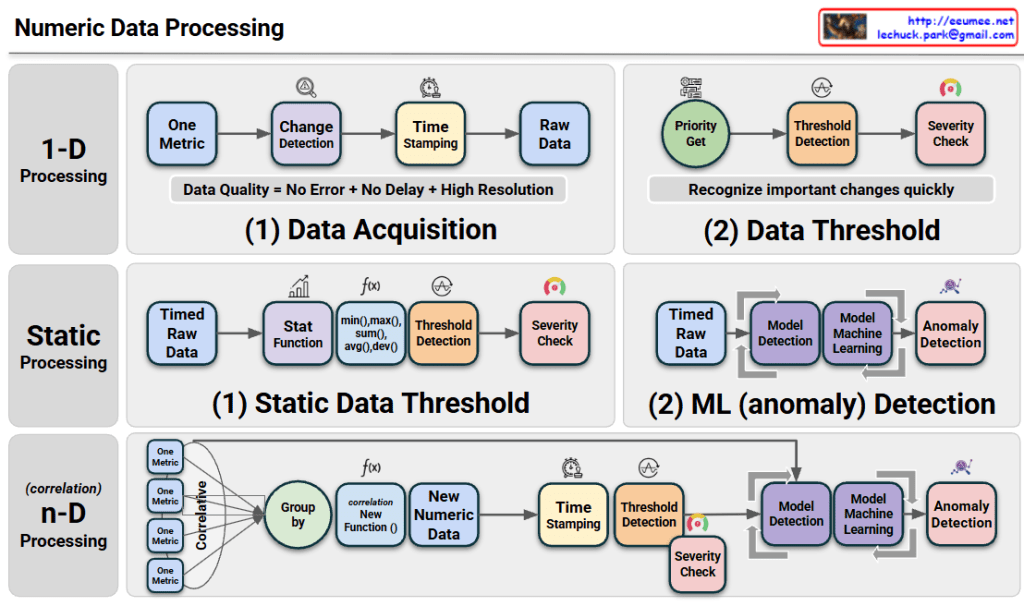
The diagram illustrates a tiered approach to Numeric Data Processing, moving from simple monitoring to advanced predictive analytics:
- 1-D Processing (Real-time Detection): This layer focuses on individual metrics. It emphasizes high-resolution data acquisition with precise time-stamping to ensure data quality. It uses immediate threshold detection to recognize critical changes as they happen.
- Static Processing (Statistical & ML Analysis): This stage introduces historical context. It applies statistical functions (like averages and deviations) to identify trends and uses Machine Learning (ML) models to detect anomalies that simple thresholds might miss.
- n-D Processing (Correlative Intelligence): This is the most sophisticated layer. It groups multiple metrics to find correlations, creating “New Numeric Data” (synthetic metrics). By analyzing the relationship between different data points, it can identify complex root causes in highly interleaved systems.
Summary
- The framework transitions from reactive 1-D monitoring to proactive n-D correlation, enhancing the depth of system observability.
- It integrates statistical functions and machine learning to filter noise and identify true anomalies based on historical patterns rather than just fixed limits.
- The ultimate goal is to achieve high-fidelity data processing that enables automated severity detection and complex pattern recognition across multi-dimensional datasets.
#DataProcessing #AIOps #MachineLearning #Observability #Telemetry #SystemArchitecture #AnomalyDetection #DigitalTwin #DataCenterOps #InfrastructureMonitoring
With Gemini