Multi-DCs Operation with a LLM (1)

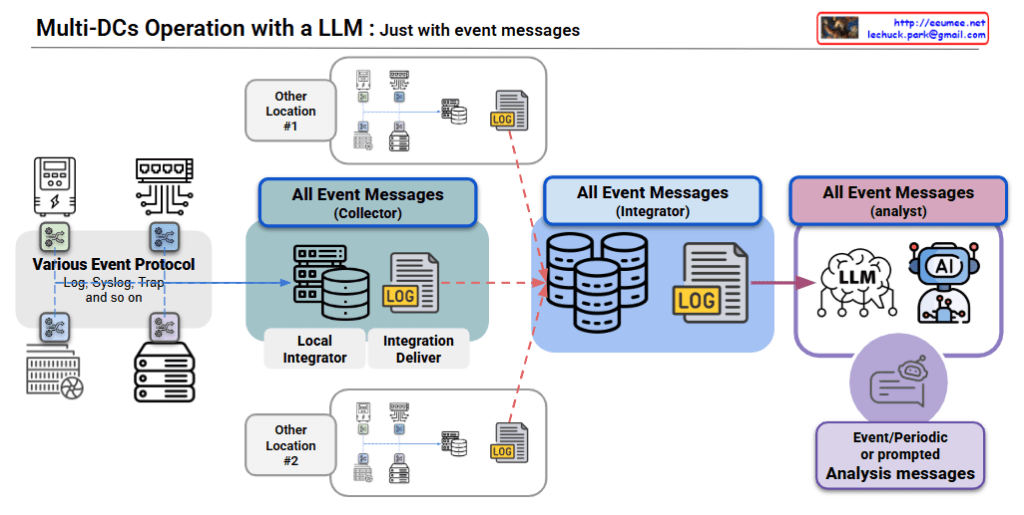
This diagram illustrates a Multi-Data Center Operations Architecture leveraging LLM (Large Language Model) with Event Messages.

Key Components

1. Data Collection Layer (Left Side)

  • Collects data from various sources through multiple event protocols (Log, Syslog, Trap, etc.)
  • Gathers event data from diverse servers and network equipment

2. Event Message Processing (Center)

  • Collector: Comprises Local Integrator and Integration Deliver to process event messages
  • Integrator: Manages and consolidates event messages in a multi-database environment
  • Analyst: Utilizes AI/LLM to analyze collected event messages

3. Multi-Location Support

  • Other Location #1 and #2 maintain identical structures for event data collection and processing
  • All location data is consolidated for centralized analysis

4. AI-Powered Analysis (Right Side)

  • LLM: Intelligently analyzes all collected event messages
  • Event/Periodic or Prompted Analysis Messages: Generates automated alerts and reports based on analysis results

System Characteristics

This architecture represents a modern IT operations management solution that monitors and manages multi-data center environments using event messages. The system leverages LLM technology to intelligently analyze large volumes of log and event data, providing operational insights for enhanced data center management.

The key advantage is the unified approach to handling diverse event streams across multiple locations while utilizing AI capabilities for intelligent pattern recognition and automated response generation.

With Claude

Data Center ?

This infographic compares the evolution from servers to data centers, showing the progression of IT infrastructure complexity and operational requirements.

Left – Server

  • Shows individual hardware components: CPU, motherboard, power supply, cooling fans
  • Labeled “No Human Operation,” indicating basic automated functionality

Center – Modular DC

  • Represented by red cubes showing modular architecture
  • Emphasizes “More Bigger” scale and “modular” design
  • Represents an intermediate stage between single servers and full data centers

Right – Data Center

  • Displays multiple server racks and various infrastructure components (networking, power, cooling systems)
  • Marked as “Human & System Operation,” suggesting more complex management requirements

Additional Perspective on Automation Evolution:

While the image shows data centers requiring human intervention, the actual industry trend points toward increasing automation:

  1. Advanced Automation: Large-scale data centers increasingly use AI-driven management systems, automated cooling controls, and predictive maintenance to minimize human intervention.
  2. Lights-Out Operations Goal: Hyperscale data centers from companies like Google, Amazon, and Microsoft ultimately aim for complete automated operations with minimal human presence.
  3. Paradoxical Development: As scale increases, complexity initially requires more human involvement, but advanced automation eventually enables a return toward unmanned operations.

Summary: This diagram illustrates the current transition from simple automated servers to complex data centers requiring human oversight, but the ultimate industry goal is achieving fully automated “lights-out” data center operations. The evolution shows increasing complexity followed by sophisticated automation that eventually reduces the need for human intervention.

With Claude

HOPE OF THE NEXT

Hope to jump

This image visualizes humanity’s endless desire for ‘difference’ as the creative force behind ‘newness.’ The organic human brain fuses with the logical AI circuitry, and from their core, a burst of light emerges. This light symbolizes not just the expansion of knowledge, but the very moment of creation, transforming into unknown worlds and novel concepts.

Data Center Operantions

Data center operations are shifting from experience-driven practices toward data-driven and AI-optimized systems.
However, a fundamental challenge persists: the lack of digital credibility.

  • Insufficient data quality: Incomplete monitoring data and unreliable hardware reduce trust.
  • Limited digital expertise of integrators: Many providers focus on traditional design/operations, lacking strong datafication and automation capabilities.
  • Absence of verification frameworks: No standardized process to validate or certify collected data and analytical outputs.

These gaps are amplified by the growing scale and complexity of data centers and the expansion of GPU adoption, making them urgent issues that must be addressed for the next phase of digital operations.

Numbers about power

kW (Instantaneous Power) ↔ UPS (Uninterruptible Power Supply)

UPS Core Objective: Instantaneous Power Supply Capability

  • kW represents the power needed “right now at this moment”
  • UPS priority is immediate power supply during outages
  • Like the “speed” concept in the image, UPS focuses on instantaneous power delivery speed
  • Design actual kW capacity considering Power Factor (PF) 0.8-0.95
  • Calculate total load (kW) reflecting safety factor, growth rate, and redundancy

kWh (Energy Capacity) ↔ ESS (Energy Storage System)

ESS Core Objective: Sustained Energy Supply Capability

  • kWh indicates “how long” power can be supplied
  • ESS priority is long-term stable power supply
  • Like the “distance” concept in the image, ESS focuses on power supply duration
  • Required ESS capacity = Total Load (kW) × Desired Runtime (Hours)
  • Design actual storage capacity considering efficiency rate

Complementary Operation Strategy

Phase 1: UPS Immediate Response

  • Power outage → UPS immediately supplies power in kW units
  • Short-term power supply for minutes to tens of minutes

Phase 2: ESS Long-term Support

  • Extended outages → ESS provides sustained power in kWh units
  • Long-term power supply for hours to days

Summary: This structure optimally matches kW (instantaneousness) with UPS strengths and kWh (sustainability) with ESS capabilities. UPS handles immediate power needs while ESS ensures long-duration supply, creating a comprehensive power backup solution.

With Claude

Data Center Mgt. System Req.

System Components (Top Level)

Six core components:

  • Facility: Data center physical infrastructure
  • Data List: Data management and cataloging
  • Data Converter: Data format conversion
  • Network: Network infrastructure
  • Server: Server hardware
  • Software (Database): Applications and database systems

Universal Mandatory Requirements

Fundamental requirements applied to ALL components:

  • Stability (24/7 HA): 24/7 High Availability – All systems must operate continuously without interruption
  • Performance: Optimal performance assurance – All components must meet required performance levels

Component-Specific Additional Requirements

1. Data List

  • Sampling Rate, Computing Power, HW/SW Interface

2. Data Converter

  • Data Capacity, Computing Power, Program Logic (control facilities), High Availability

3. Network

  • Private NW, Bandwidth, Architecture (L2/L3, Ring/Star), UTP/Optic, Management Include

4. Server

  • Computing Power, Storage Sizing, High Availability, External (Public Network)

5. Software/Database

  • Data Integrity, Cloud-like High Availability & Scale-out, Monitoring, Event Management, Analysis (AI)

This architecture emphasizes that stability and performance are fundamental prerequisites for data center operations, with each component having its own specific additional requirements built upon these two essential foundation requirements.

With Claude

Temperate Prediction in DC

Overall Structure

Top: CFD (Computational Fluid Dynamics) based approach Bottom: ML (Machine Learning) based approach

CFD Approach (Top)

  • Basic Setup:
    • Spatial Definition & Material Properties: Physical space definition of the data center and material characteristics (servers, walls, air, etc.)
    • Boundary Conditions: Setting boundary conditions (inlet/outlet temperatures, airflow rates, heat sources, etc.)
  • Processing:
    • Configuration + Physical Rules: Application of physical laws (heat transfer equations, fluid dynamics equations, etc.)
    • Heat Flow: Heat flow calculations based on defined conditions
  • Output: Heat + Air Flow Simulation (physics-based heat and airflow simulation)

ML Approach (Bottom)

  • Data Collection:
    • Real-time monitoring through Metrics/Data Sensing
    • Operational data: Power (Kw), CPU (%), Workload, etc.
    • Actual temperature measurements through Temperature Sensing
  • Processing: Pattern learning through Machine Learning algorithms
  • Output: Heat (with Location) Prediction (location-specific heat prediction)

Key Differences

CFD Method: Theoretical calculation through physical laws using physical space definitions, material properties, and boundary conditions as inputs ML Method: Data-driven approach that learns from actual operational data and sensor information for prediction

The key distinction is that CFD performs simulation from predefined physical conditions, while ML learns from actual operational data collected during runtime to make predictions.

With Claude