DC Power(R)

Data Center DC Power System Comprehensive Overview

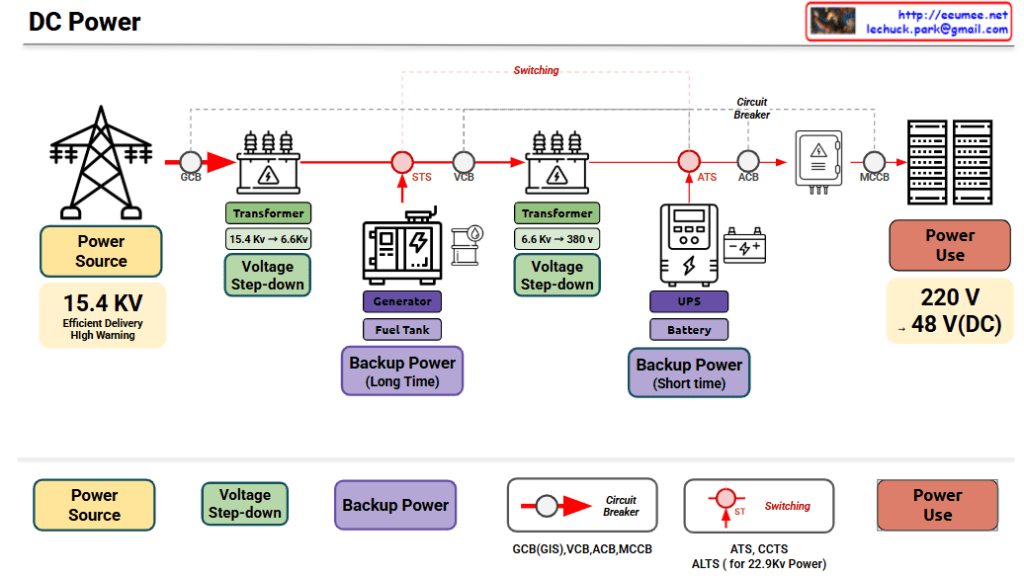
This diagram illustrates the complete DC (Direct Current) power supply system for a data center infrastructure.

1. Core Components

① Power Source

  • 15.4 KV High Voltage AC Power
  • Received from utility grid
  • Efficient long-distance transmission (Efficient Delivery)
  • High voltage warning indicator (High Warning)

② Primary Transformer

  • Voltage conversion: 15.4 KV → 6.6 KV
  • Function: Steps down high voltage to medium voltage
  • Transformation method: Voltage Step-down
  • Adjusts voltage for internal data center distribution

③ Backup Power #1 – Generator System (Long-Time Backup)

  • Configuration: Diesel generator + Fuel tank
  • Characteristic: Long-duration backup capability
  • Purpose: Continuous power supply during main power outage
  • Advantage: Unlimited operation as long as fuel is supplied

④ Secondary Transformer

  • Voltage conversion: 6.6 KV → 380 V
  • Function: Steps down medium voltage to low voltage
  • Transformation method: Voltage Step-down
  • Provides appropriate voltage for UPS and final loads

⑤ Backup Power #2 – UPS System (Short-Time Backup)

  • Configuration: UPS + Battery
  • Characteristic: Short-duration instantaneous backup
  • Purpose: Ensures uninterrupted power during main-to-generator transition
  • Role: Supplies power during generator startup time (10-30 seconds)

⑥ Final Load (Power Use)

  • Output voltage: 220 V AC or 48 V DC
  • Target: Servers, network equipment, storage systems
  • Feature: Stable IT infrastructure operation with DC power

2. Voltage Conversion Flow

15.4 KV (AC)  →  6.6 KV (AC)  →  380 V (AC)  →  48 V (DC) / 220 V
  [Reception]   [Primary TX]   [Secondary TX]   [Final Conversion]

3. Redundant Backup Architecture

Two-Tier Backup System

Main Power (15.4 KV) ─────┐
                          ├──→ Transform ──→ Load
Generator (Long-term) ────┘
         ↓
    UPS/Battery (Short-term) ──→ Instantaneous uninterrupted guarantee

Backup Strategy:

  • Generator: Hours to days operation (fuel-dependent)
  • UPS: Minutes to tens of minutes operation (battery capacity-dependent)
  • Combined effect: UPS covers generator startup gap to achieve complete uninterrupted power

4. Operating Scenarios

Scenario 1: Normal Operation

Utility power (15.4KV) → Primary transform (6.6KV) → Secondary transform (380V) → UPS → DC load (48V)

Scenario 2: Momentary Power Outage

  1. Main power interruption detected (< 4ms)
  2. UPS battery immediately engaged
  3. Continuous power supply to load with zero interruption

Scenario 3: Extended Power Outage

  1. Main power interruption detected
  2. UPS battery immediately engaged (maintains uninterrupted power)
  3. Generator automatically starts (10-30 seconds required)
  4. Generator reaches rated capacity and replaces main power
  5. Generator power charges UPS + supplies load
  6. Long-term operation with continuous fuel supply

Scenario 4: Generator Failure

  • Limited-time operation within UPS battery capacity
  • Priority operation for critical systems or graceful shutdown

5. Additional Protection and Control Devices

Supplementary devices for system stability and safety:

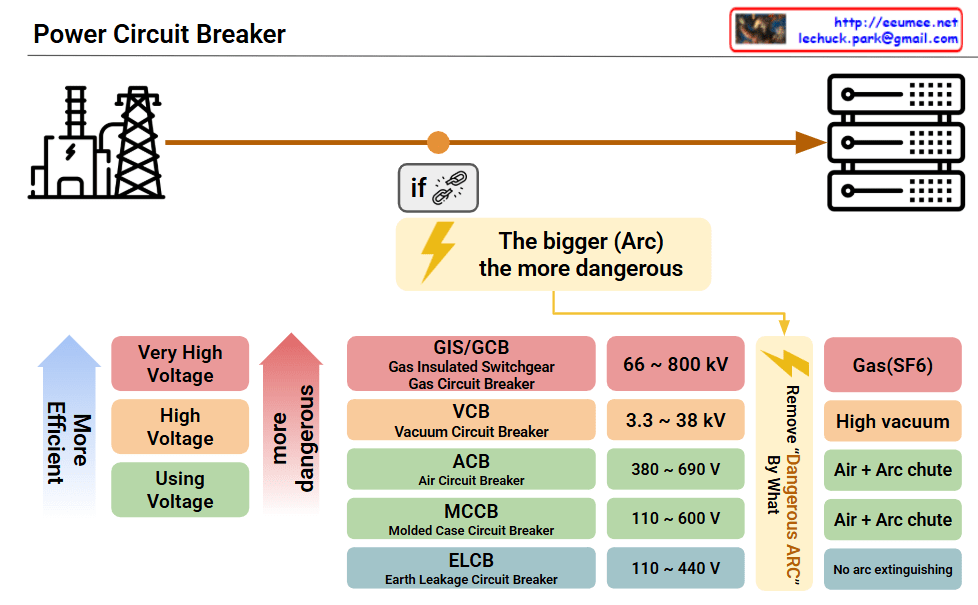
Circuit Breaker Hierarchy

  • GCB (Generator Circuit Breaker): Primary protection at reception point
  • VCB (Vacuum Circuit Breaker): Vacuum interruption, medium voltage protection
  • ACB (Air Circuit Breaker): Low voltage distribution panel protection
  • MCCB (Molded Case Circuit Breaker): Individual load protection
  • Role: Circuit interruption during overload or short circuit to protect equipment and personnel

Switching Devices

  • STS (Static Transfer Switch): High-speed transfer between main power ↔ generator
  • ATS (Automatic Transfer Switch): Automatic transfer between power sources ( UPS level)
  • ALTS (Automatic Load Transfer Switch): Automatic load transfer ( for 22.9kV class)
  • CCTS: Circuit breaker control and transfer system
  • Role: Automatic/immediate transfer to backup power during power failure

Switching Points (Red circle indicators)

  • Reception point, before/after transformers, backup power injection points
  • Critical points for power path changes and redundancy implementation

6. Key System Features

Uninterruptible Power Supply: Three-stage protection with main power → generator → UPS
Multi-stage Voltage Conversion: Ensures both transmission efficiency and usage safety
Automated Backup Transfer: Automatic switching without human intervention
Hierarchical Protection: Stage-by-stage circuit breakers prevent cascading failures
Scalable Architecture: Modular configuration enables easy capacity expansion


Summary

This DC power system architecture ensures continuous, uninterrupted operation of mission-critical data center infrastructure through a sophisticated combination of redundant power sources, automated failover mechanisms, and multi-layered protection systems. The integration of long-term generator backup and short-term UPS battery systems creates a seamless power continuity solution that can handle any grid interruption scenario. The multi-stage voltage transformation (15.4KV → 6.6KV → 380V → 48V DC) optimizes both transmission efficiency and end-user safety while providing flexibility for diverse IT equipment requirements.


#DataCenter #DCPower #PowerSystems #CriticalInfrastructure #UPS #BackupPower #DataCenterDesign #ElectricalEngineering #PowerDistribution #MissionCritical #DataCenterInfrastructure #FacilityManagement #PowerReliability #UninterruptiblePowerSupply #DataCenterOperations

With Claude

CDU ( OCP Project Deschutes ) Numbers

OCP CDU (Deschutes) Standard Overview

The provided visual summarizes the key performance metrics of the CDU (Cooling Distribution Unit) that adheres to the OCP (Open Compute Project) ‘Project Deschutes’ specification. This CDU is designed for high-performance computing environments, particularly for massive-scale liquid cooling of AI/ML workloads.


Key Performance Indicators

  • System Availability: The primary target for system availability is 99.999%. This represents an extremely high level of reliability, with less than 5 minutes and 15 seconds of downtime per year.
  • Thermal Load Capacity: The CDU is designed to handle a thermal load of up to 2,000 kW, which is among the highest thermal capacities in the industry.
  • Power Usage: The CDU itself consumes 74 kW of power.
  • IT Flow Rate: It supplies coolant to the servers at a rate of 500 GPM (approximately 1,900 LPM).
  • Operating Pressure: The overall system operating pressure is within a range of 0-130 psig (approximately 0-900 kPa).
  • IT Differential Pressure: The pressure difference required on the server side is 80-90 psi (approximately 550-620 kPa).
  • Approach Temperature: The approach temperature, a key indicator of heat exchange efficiency, is targeted at ≤3∘C. A lower value is better, as it signifies more efficient heat removal.

Why Cooling is Crucial for GPU Performance

Cooling has a direct and significant impact on GPU performance and stability. Because GPUs are highly sensitive to heat, if they are not maintained within an optimal temperature range, they will automatically reduce their performance through a process called thermal throttling to prevent damage.

The ‘Project Deschutes’ CDU is engineered to prevent this by handling a massive thermal load of 2,000 kW with a powerful 500 GPM flow rate and a low approach temperature of ≤3∘C. This robust cooling capability ensures that GPUs can operate at their maximum potential without being limited by heat, which is essential for maximizing performance in demanding AI workloads.

with Gemini

Multi-DCs Operation with a LLM (4)

LLM-Based Multi-Datacenter Operation System

System Architecture

3-Stage Processing Pipeline: Collector → Integrator → Analyst

  • Event collection from various protocols
  • Data normalization through local integrators
  • Intelligent analysis via LLM/AI analyzers
  • RAG data expansion through bottom Data Add-On modules

Core Functions

1. Time-Based Event Aggregation Analysis

  • 60-second intervals (adjustable) for event bundling
  • Comprehensive situational analysis instead of individual alarms
  • LLM queries with predefined prompts

Effectiveness:

  • ✅ Resolves alarm fatigue and enables correlation analysis
  • ✅ Improves operational efficiency through periodic comprehensive reports
  • ⚠️ Potential delay in immediate response to critical issues ( -> Using a legacy/local monitoring system )

2. RAG-Based Data Enhancement

  • Extension data: Metrics, manuals, configurations, maintenance records
  • Reuse of past analysis results as learning data
  • Improved accuracy through domain-specific knowledge accumulation

Effectiveness:

  • ✅ Continuous improvement of analysis quality and increased automation
  • ✅ Systematization of operational knowledge and organizational capability enhancement

Innovative Value

  • Paradigm Shift: Reactive → Predictive/Contextual analysis
  • Operational Burden Reduction: Transform massive alarms into meaningful insights
  • Self-Evolution: Continuous learning system through RAG framework

Executive Summary: This system overcomes the limitations of traditional individual alarm approaches and represents an innovative solution that intelligentizes datacenter operations through time-based event aggregation and LLM analysis. As a self-evolving monitoring system that continuously learns and develops through RAG-based data enhancement, it is expected to dramatically improve operational efficiency and analysis accuracy.

With Claude

Switching of the power

This diagram illustrates two main power switching methods used in electrical systems: ATS (Automatic Transfer Switch) and STS (Static Transfer Switch).

System Configuration

  • Power Sources: Utility grid and Generator
  • Protection: UPS systems
  • Load: Server infrastructure

ATS (Automatic Transfer Switch)

Location: Switchgear Area (Power Distribution Board)

Characteristics:

  • Mechanism: Mechanical breakers/contacts
  • Transfer Time: Several seconds (including generator start-up)
  • Advantages: Relatively simple, lower cost
  • Application: Standard power transfer systems

STS (Static Transfer Switch)

Location: Panelboard Area (Distribution Panel)

Characteristics:

  • Mechanism: Semiconductor devices (SCR, IGBT)
  • Transfer Time: A few milliseconds (near seamless)
  • Advantages: Ensures high-quality power supply
  • Disadvantages: Expensive

Key Differences

  1. Transfer Speed: STS is significantly faster (milliseconds vs seconds)
  2. Technology: ATS uses mechanical switching, STS uses electronic switching
  3. Cost: ATS is more economical
  4. Power Quality: STS provides more stable power delivery
  5. Complexity: STS requires more sophisticated semiconductor control

Applications

  • ATS: Suitable for applications that can tolerate brief power interruptions
  • STS: Critical for sensitive equipment like servers, data centers, and medical facilities requiring uninterrupted power

Summary: This diagram shows a redundant power system where ATS provides cost-effective backup power switching while STS offers near-instantaneous transfer for critical loads. Both systems work together with UPS backup to ensure continuous power supply to servers and sensitive equipment.

With Claude

Multi-DCs Operation with a LLM(3)

This diagram presents the 3 Core Expansion Strategies for Event Message-based LLM Data Center Operations System.

System Architecture Overview

Basic Structure:

  • Collects event messages from various event protocols (Log, Syslog, Trap, etc.)
  • 3-stage processing pipeline: Collector → Integrator → Analyst
  • Final stage performs intelligent analysis using LLM and AI

3 Core Expansion Strategies

1️⃣ Data Expansion (Data Add On)

Integration of additional data sources beyond Event Messages:

  • Metrics: Performance indicators and metric data
  • Manuals: Operational manuals and documentation
  • Configures: System settings and configuration information
  • Maintenance: Maintenance history and procedural data

2️⃣ System Extension

Infrastructure scalability and flexibility enhancement:

  • Scale Up/Out: Vertical/horizontal scaling for increased processing capacity
  • To Cloud: Cloud environment expansion and hybrid operations

3️⃣ LLM Model Enhancement (More Better Model)

Evolution toward DC Operations Specialized LLM:

  • Prompt Up: Data center operations-specialized prompt engineering
  • Nice & Self LLM Model: In-house development of DC operations specialized LLM model construction and tuning

Strategic Significance

These 3 expansion strategies present a roadmap for evolving from a simple event log analysis system to an Intelligent Autonomous Operations Data Center. Particularly, through the development of in-house DC operations specialized LLM, the goal is to build an AI system that achieves domain expert-level capabilities specifically tailored for data center operations, rather than relying on generic AI tools.

With Claude

Multi-DCs Operation with a LLM (2)

This diagram illustrates a Multi-Data Center Operation with LLM architecture system configuration.

Overall Architecture Components

Left Side – Event Sources:

  • Various systems supporting different event protocols (Log, Syslog, Trap, etc.) generating events

Middle – 3-Stage Processing Pipeline:

  1. Collector – Light Blue
    • Composed of Local Integrator and Integration Deliver
    • Collects and performs initial processing of all event messages
  2. Integrator – Dark Blue
    • Stores/manages event messages in databases and log files
    • Handles data integration and normalization
  3. Analyst – Purple
    • Utilizes LLM and AI for event analysis
    • Generates event/periodic or immediate analysis messages

Core Efficiency of LLM Operations Integration (Bottom 4 Features)

  • Already Installed: Leverages pre-analyzed logical results from existing alert/event systems, enabling immediate deployment without additional infrastructure
  • Highly Reliable: Alert messages are highly deterministic data that significantly reduce LLM error possibilities and ensure stable analysis results
  • Easy Integration: Uses pre-structured alert messages, allowing simple integration with various systems without complex data preprocessing
  • Nice LLM: Operates reliably based on verified alert data and provides an optimal strategy for rapidly applying advanced LLM technology

Summary

This architecture enables rapid deployment of advanced LLM technology by leveraging existing alert infrastructure as high-quality, deterministic input data. The approach minimizes AI-related risks while maximizing operational intelligence, offering immediate deployment with proven reliability.

With Claude

Power Circuit Breaker

This image presents a Power Circuit Breaker classification diagram showing the types and characteristics of electrical circuit breakers used in power systems.

System Overview

Power Flow: The diagram illustrates the electrical power path from power plant → transmission lines → circuit breakers → distribution panels.

Circuit Breaker Classification

The breakers are categorized by voltage levels and arc extinguishing methods:

Voltage Classifications

  • Very High Voltage: 66~800kV
  • High Voltage: 3.3~38kV
  • Using Voltage: 380~690V, 110~600V, 110~440V

Breaker Types and Arc Extinguishing Methods

  1. GIS/GCB (Gas Insulated Switchgear/Gas Circuit Breaker)
    • 66~800kV
    • Uses SF6 gas with high vacuum technology
  2. VCB (Vacuum Circuit Breaker)
    • 3.3~38kV
    • Vacuum arc extinguishing method
  3. ACB (Air Circuit Breaker)
    • 380~690V
    • Air + arc chute method
  4. MCCB (Molded Case Circuit Breaker)
    • 110~600V
    • Air + arc chute method
  5. ELCB (Earth Leakage Circuit Breaker)
    • 110~440V
    • Ground fault protection, no arc extinguishing

Key Safety Message

The diagram emphasizes “The bigger (Arc) the more dangerous” – highlighting that higher voltages require more sophisticated and safer arc extinguishing technologies.

Summary: This technical diagram systematically categorizes power circuit breakers from ultra-high voltage (800kV) to low voltage (110V) applications, demonstrating how arc extinguishing complexity increases with voltage levels. The chart serves as an educational reference showing that higher voltage systems require more advanced safety mechanisms like SF6 gas insulation, while lower voltage applications can use simpler air-based arc interruption methods.

With Claude