Power Changes for AI DC

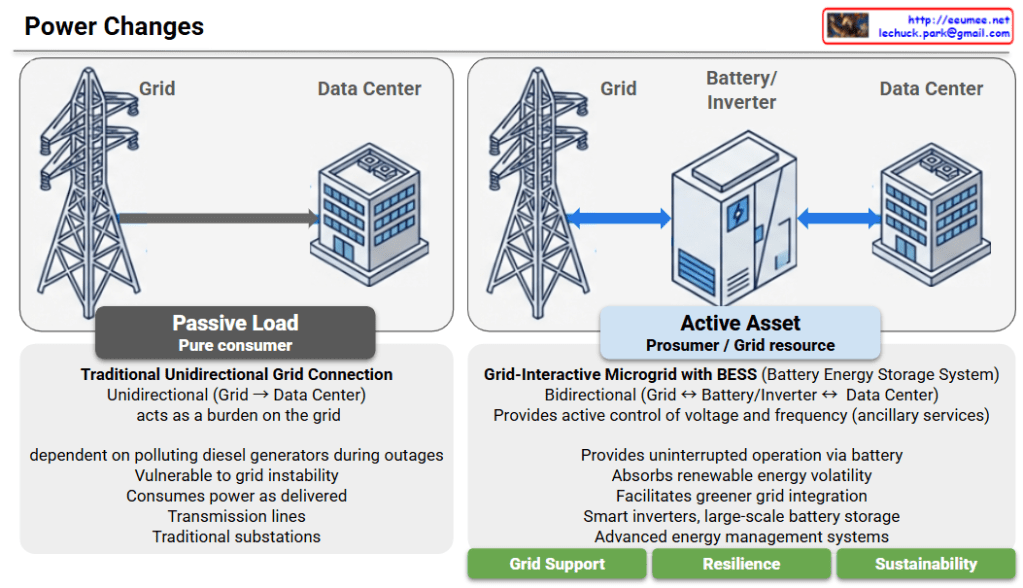
Power Architecture Evolution: From Passive Load to Active Asset

This diagram illustrates the critical evolution of data center power systems, highlighting the shift from a traditional “Passive Load” model to an “Active Asset” model. This transition is emerging as an essential power architecture and strategic direction for future AI Data Centers (AI DCs), which demand massive energy consumption and absolute operational stability.

1. AS-IS: Passive Load (Pure Consumer)

  • Traditional Unidirectional Grid Connection: Power flows in only one direction (Grid -> Data Center).
  • Grid Burden: The facility acts solely as a massive energy consumer, placing a heavy burden on the power grid.
  • Vulnerability & Pollution: It is vulnerable to grid instability and relies heavily on polluting diesel generators during power outages.
  • Infrastructure: It relies on traditional transmission lines and substations, consuming power exactly as it is delivered without any grid interaction.

2. TO-BE: Active Asset (Prosumer / Grid Resource)

  • Grid-Interactive Microgrid with BESS: Integrates a Battery Energy Storage System (BESS) for intelligent and flexible power management.
  • Bidirectional Flow: Power can flow both ways (Grid <-> Battery/Inverter <-> Data Center), allowing the facility to function as a “prosumer.”
  • Grid Support (Ancillary Services): Actively provides control over voltage and frequency to help stabilize the broader power grid.
  • Resilience & Sustainability: Ensures uninterrupted operation via large-scale battery storage, significantly reducing diesel dependency. It also absorbs the volatility of renewable energy, facilitating a greener grid integration.
  • Key Technologies: Driven by smart inverters, large-scale batteries, and Advanced Energy Management Systems (EMS).

Conclusion: An Indispensable Power Direction for AI DCs

Rather than simply acting as facilities that drain massive amounts of electricity, modern data centers must evolve into grid-interactive assets. Given the exponential surge in power demands and the strict continuous operation requirements of AI workloads, adopting this “Active Asset” architecture with BESS and smart inverters is no longer just an eco-friendly alternative—it is an essential and inevitable power infrastructure direction for the successful deployment and scaling of AI Data Centers.

#AIDC #AIDataCenter #DataCenterInfrastructure #ESS #Inverter #GridInteractive

With Gemini

Legacy DC vs AI DC

This infographic illustrates the radical shift in operational paradigms between Legacy Data Centers and AI Data Centers, highlighting the transition from “Human-Speed” steady-state management to “Machine-Speed” real-time automation.


📊 Legacy DC vs. AI DC: Operational Metrics Comparison

CategoryLegacy DCAI DCDelta / Impact
Power Density5 ~ 15 kW / Rack40 ~ 120 kW / Rack8x ~ 10x Density
Thermal Ramp Rate0.5 ~ 2.0°C / Min10 ~ 20°C / MinExtreme Heat Surge
Thermal Ride-through10 ~ 20 Minutes30 ~ 90 Seconds90% Buffer Loss
Cooling UPS Backup20 ~ 30% (Partial)100% (Full Redundancy)Mission-Critical Cooling
Telemetry Sampling1 ~ 5 Minutes< 1 Second (Real-time)60x Precision
Coolant Flow RateN/A (Air-cooled)60 ~ 150 LPM (Liquid)Liquid-to-Chip Essential
Automated Failsafe5 ~ 10 Minutes5 ~ 10 SecondsUltra-fast Shutdown

🔍 Graphical Analysis

1. The Volatility Gap

  • Legacy DC: Shows a stable, predictable power load across a 24-hour cycle. Operations are steady-state and managed on an hourly basis.
  • AI DC: Features extreme load fluctuations that can reach critical levels within just 3 minutes. This requires monitoring and response to be measured in minutes and seconds rather than hours.

2. The Cooling Imperative

With rack densities reaching 120 kW, air cooling is no longer viable. The shift to Liquid-to-Chip cooling with flow rates up to 150 LPM is mandatory to manage the 10–20°C per minute thermal ramp rates.

3. The End of Manual Intervention

In a Legacy DC, operators have a 20-minute “Golden Hour” to respond to cooling failures. In an AI DC, this buffer collapses to seconds, making sub-second telemetry and automated failsafe protocols the only way to prevent hardware damage.


💡 Summary

  1. Density & Cooling Leap: AI DC demands up to 10x higher power density, necessitating a fundamental shift from traditional air cooling to Direct-to-Chip liquid cooling.
  2. Vanishing Buffer Time: Thermal ride-through time has shrunk from 20 minutes to less than 90 seconds, leaving zero room for manual human intervention during failures.
  3. Real-Time Autonomy: The operational paradigm has shifted to “Machine-Speed” automated control, requiring sub-second telemetry to handle extreme load volatility and ultra-fast failsafe needs.

#AIDataCenter #AIOps #LiquidCooling #InfrastructureOptimization #DataCenterDesign #HighDensityComputing #ThermalManagement #DigitalTransformation

With Gemini

CDU Metrics & Control

This image shows a CDU (Coolant Distribution Unit) Metrics & Control System diagram illustrating the overall structure. The system can be organized as follows:

System Structure

Upper Section: CDU Structure

  • First Loop: CPU with Coolant Distribution Unit
  • Second Main Loop: Row Manifold and Rack Manifold configuration
  • Process Chill Water Supply/Return: Process chilled water circulation system

Lower Section: Data Collection & Control Devices

  • Control Devices:
    • Pump (Pump RPM, Rate of max speed)
    • Valve (Valve Open %)
  • Sensor Configuration:
    • Temperature & Pressure Sensors on manifolds
  • Supply System:
    • Rack Water Supply/Return

Main Control Methods

1. Fixed Pressure Control (Fixed Pressure Drop)

  • Primary Method: Maintaining fixed pressure drop between rack supply-return
  • Alternatives: Fixed flow rate, fixed supply temperature, fixed return temperature, fixed speed control

2. Approach Temperature Control

  • Primary Method: Maintaining constant approach temperature
  • Alternatives: Fixed open, fixed secondary supply temperature control

Summary

This CDU system provides precise cooling control for data centers through dual management of pressure and temperature. The system integrates sensor feedback from manifolds with pump and valve control to maintain optimal cooling conditions across server racks.

#CDU #CoolantDistribution #DataCenterCooling #TemperatureControl #PressureControl #ThermalManagement

with Claude

Multi-DCs Operation with a LLM(3)

This diagram presents the 3 Core Expansion Strategies for Event Message-based LLM Data Center Operations System.

System Architecture Overview

Basic Structure:

  • Collects event messages from various event protocols (Log, Syslog, Trap, etc.)
  • 3-stage processing pipeline: Collector → Integrator → Analyst
  • Final stage performs intelligent analysis using LLM and AI

3 Core Expansion Strategies

1️⃣ Data Expansion (Data Add On)

Integration of additional data sources beyond Event Messages:

  • Metrics: Performance indicators and metric data
  • Manuals: Operational manuals and documentation
  • Configures: System settings and configuration information
  • Maintenance: Maintenance history and procedural data

2️⃣ System Extension

Infrastructure scalability and flexibility enhancement:

  • Scale Up/Out: Vertical/horizontal scaling for increased processing capacity
  • To Cloud: Cloud environment expansion and hybrid operations

3️⃣ LLM Model Enhancement (More Better Model)

Evolution toward DC Operations Specialized LLM:

  • Prompt Up: Data center operations-specialized prompt engineering
  • Nice & Self LLM Model: In-house development of DC operations specialized LLM model construction and tuning

Strategic Significance

These 3 expansion strategies present a roadmap for evolving from a simple event log analysis system to an Intelligent Autonomous Operations Data Center. Particularly, through the development of in-house DC operations specialized LLM, the goal is to build an AI system that achieves domain expert-level capabilities specifically tailored for data center operations, rather than relying on generic AI tools.

With Claude

Temperate Prediction in DC (II) – The start and The Target

This image illustrates the purpose and outcomes of temperature prediction approaches in data centers, showing how each method serves different operational needs.

Purpose and Results Framework

CFD Approach – Validation and Design Purpose

Input:

  • Setup Data: Physical infrastructure definitions (100% RULES-based)
  • Pre-defined spatial, material, and boundary conditions

Process: Physics-based simulation through computational fluid dynamics

Results:

  • What-if (One Case) Simulation: Theoretical scenario testing
  • Checking a Limitation: Validates whether proposed configurations are “OK or not”
  • Used for design validation and capacity planning

ML Approach – Operational Monitoring Purpose

Input:

  • Relation (Extended) Data: Real-time operational data starting from workload metrics
  • Continuous data streams: Power, CPU, Temperature, LPM/RPM

Process: Data-driven pattern learning and prediction

Results:

  • Operating Data: Real-time operational insights
  • Anomaly Detection: Identifies unusual patterns or potential issues
  • Used for real-time monitoring and predictive maintenance

Key Distinction in Purpose

CFD: “Can we do this?” – Validates design feasibility and limits before implementation

  • Answers hypothetical scenarios
  • Provides go/no-go decisions for infrastructure changes
  • Design-time tool

ML: “What’s happening now?” – Monitors current operations and predicts immediate future

  • Provides real-time operational intelligence
  • Enables proactive issue detection
  • Runtime operational tool

The diagram shows these are complementary approaches: CFD for design validation and ML for operational excellence, each serving distinct phases of data center lifecycle management.

With Claude

DC Changes

This image shows a diagram that matches 3 Environmental Changes in data centers with 3 Operational Response Changes.

Environmental Changes → Operational Response Changes

1. Hyper Scale

Environmental Change: Large-scale/Complexity

  • Systems becoming bigger and more complex
  • Increased management complexity

→ Operational Response: DevOps + Big Data/AI Prediction

  • Development-Operations integration through DevOps
  • Intelligent operations through big data analytics and AI prediction

2. New DC (New Data Center)

Environmental Change: New/Edge and various types of data centers

  • Proliferation of new edge data centers
  • Distributed infrastructure environment

→ Operational Response: Integrated Operations

  • Multi-center integrated management
  • Standardized operational processes
  • Role-based operational framework

3. AI DC (AI Data Center)

Environmental Change: GPU Large-scale Computing/Massive Power Requirements

  • GPU-intensive high-performance computing
  • Enormous power consumption

→ Operational Response: Digital Twin – Real-time Data View

  • Digital replication of actual configurations
  • High-quality data-based monitoring
  • Real-time predictive analytics including temperature prediction

This diagram systematically demonstrates that as data center environments undergo physical changes, operational approaches must also become more intelligent and integrated in response.

with Claude