From Claude with some prompting
following the overall sequence from data collection to AI systems development.
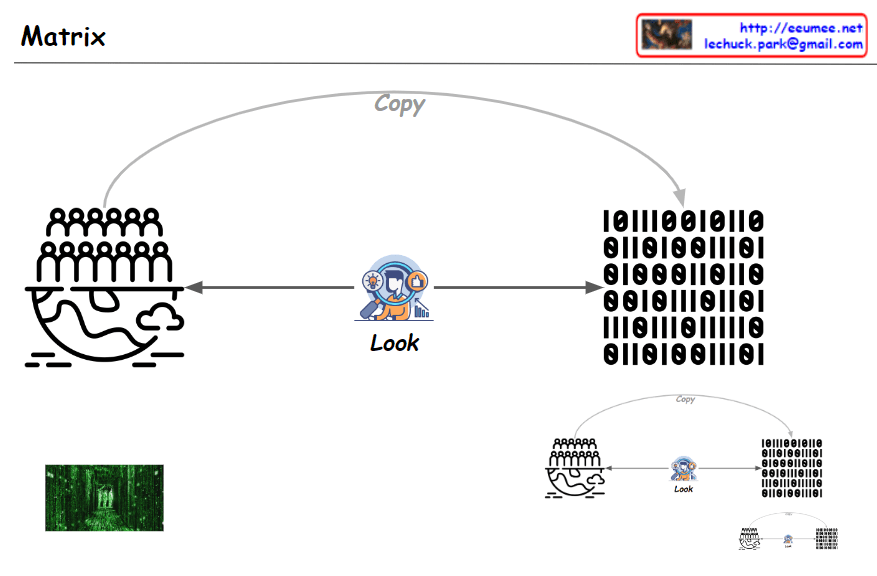
- Data Collection and Processing (Upper “From Data” section): a) Collecting data from people worldwide b) “Get Data”: Acquiring raw data c) “Gathering Data”: Converting data into binary format d) “Statistics Analysis”: Performing data analysis e) “Making Rules/Formula”: Generating rules or formulas based on analysis
- Evolution of AI Systems (Lower “Human-made AI (Legacy)” section): a) Human-centered analysis:
- “Combine formulas”: Combining rules and formulas directly created by humans
- Rule-based Machine Learning: • Utilizes Big Data • Generates rules/formulas through machine learning • Results evaluated as “True or False”
- Statistical Machine Learning (e.g., LLM): • Utilizes Big Data • Performs statistical analysis using advanced machine learning • Results evaluated as “Better or Worse”
Key Points Summary:
- Data Processing Flow: Illustrates the step-by-step process from raw data collection to rule/formula generation.
- AI System Evolution:
- Begins with human-centered rule-based systems
- Progresses to machine learning models that learn rules from data
- Advances to sophisticated statistical models (like LLMs) that recognize complex patterns and provide nuanced results
- Shift in Result Interpretation:
- Moves from simple true/false outcomes
- To relative and context-dependent “better/worse” evaluations
This image effectively demonstrates the progression of data processing and AI technology, particularly highlighting how AI systems have become more complex and sophisticated. It shows the transition from human-derived rules to data-driven machine learning approaches, culminating in advanced statistical models that can handle nuanced analysis and produce more contextualized results.