“Positional Encoding” in a Transformer

Positional Encoding in Transformer Models

The Problem: Loss of Sequential Information

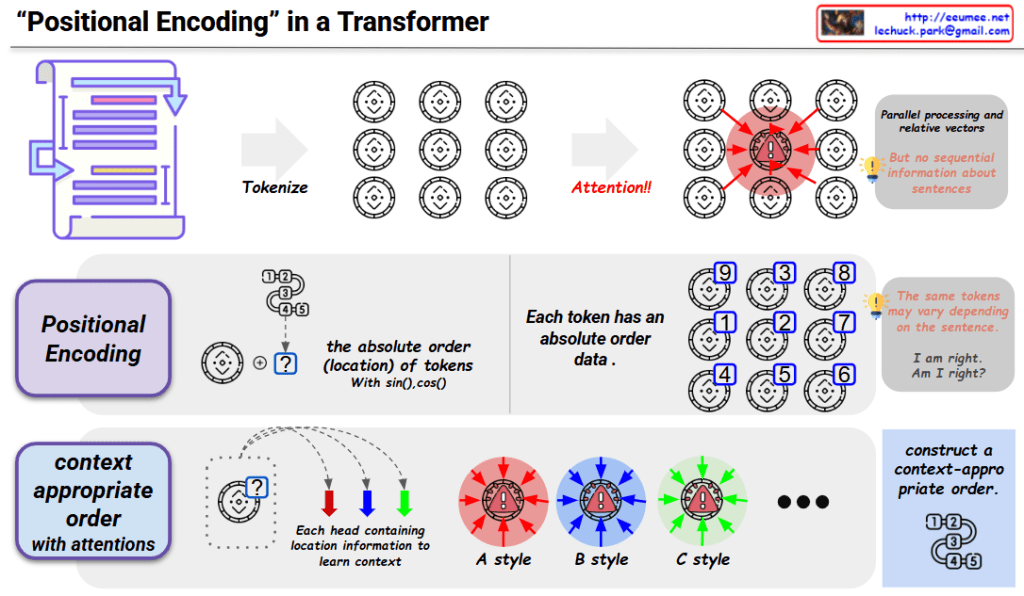
Transformer models use an attention mechanism that enables each token to interact with all other tokens in parallel, regardless of their positions in the sequence. While this parallel processing offers computational advantages, it comes with a significant limitation: the model loses all information about the sequential order of tokens. This means that without additional mechanisms, a Transformer cannot distinguish between sequences like “I am right” and “Am I right?” despite their different meanings.

The Solution: Positional Encoding

To address this limitation, Transformers implement positional encoding:

  1. Definition: Positional encoding adds position-specific information to each token’s embedding, allowing the model to understand sequence order.
  2. Implementation: The standard approach uses sinusoidal functions (sine and cosine) with different frequencies to create unique position vectors:
    • For each position in the sequence, a unique vector is generated
    • These vectors are calculated using sin() and cos() functions
    • The position vectors are then added to the corresponding token embeddings
  3. Mathematical properties:
    • Each position has a unique encoding
    • The encodings have a consistent pattern that allows the model to generalize to sequence lengths not seen during training
    • The relative positions of tokens can be expressed as a linear function of their encodings

Integration with Attention Mechanism

The combination of positional encoding with the attention mechanism enables Transformers to process tokens in parallel while maintaining awareness of their sequential relationships:

  1. Context-aware processing: Each attention head learns to interpret the positional information within its specific context.
  2. Multi-head flexibility: Different attention heads (A style, B style, C style) can focus on different aspects of positional relationships.
  3. Adaptive ordering: The model learns to construct context-appropriate ordering of tokens, enabling it to handle different linguistic structures and semantics.

Practical Impact

This approach allows Transformers to:

  • Distinguish between sentences with identical words but different orders
  • Understand syntactic structures that depend on word positions
  • Process variable-length sequences effectively
  • Maintain the computational efficiency of parallel processing while preserving sequential information

Positional encoding is a fundamental component that enables Transformer models to achieve state-of-the-art performance across a wide range of natural language processing tasks.

With Claude

CDU (Coolant Distribution Unit)

This image illustrates a Coolant Distribution Unit (CDU) with its key components and the liquid cooling system implemented in modern AI data centers. The diagram shows five primary components:

  1. Coolant Circulation and Distribution: The central component that efficiently distributes liquid coolant throughout the entire system.
  2. Heat Exchange: This section removes heat absorbed by the liquid coolant to maintain the cooling system’s efficiency.
  3. Pumping and Flow Control: Includes pumps and control devices that precisely manage the movement of coolant throughout the system.
  4. Filtration and Coolant Quality Management: A filtration system that purifies the liquid coolant and maintains optimal quality for cooling efficiency.
  5. Monitoring and Control: An interface that provides real-time monitoring and control of the entire liquid cooling system.

The three devices shown at the bottom of the diagram represent different levels of liquid cooling application in modern AI data centers:

  • Rack-level liquid cooling
  • Individual server-level liquid cooling
  • Direct processor (CPU/GPU) chip-level liquid cooling

This diagram demonstrates how advanced liquid cooling technology has evolved from traditional air cooling methods to effectively manage the high heat generated in AI-intensive modern data centers. It shows an integrated approach where the CDU facilitates coolant circulation to efficiently remove heat at rack, server, and chip levels.

With Claude

Attention in a Transformer

Attention Mechanism in Transformer Models

Overview

The attention mechanism in Transformer models is a revolutionary technology that has transformed the field of natural language processing. This technique allows each word (token) in a sentence to form direct relationships with all other words.

Working Principles

  1. Tokenization Stage: Input text is divided into individual tokens.
  2. Attention Application: Each token calculates its relevance to all other tokens.
  3. Mathematical Implementation:
    • Each token is converted into Query, Key, and Value vectors.
    • The relevance between a specific token (Query) and other tokens (Keys) is calculated.
    • Weights are applied to the Values based on the calculated relevance.
    • This is expressed as the ‘sum of Value * Weight’.

Multi-Head Attention

  • Definition: A method that calculates multiple attention vectors for a single token in parallel.
  • Characteristics: Each head (styles A, B, C) captures token relationships from different perspectives.
  • Advantage: Can simultaneously extract various information such as grammatical relationships and semantic associations.

Key Benefits

  1. Contextual Understanding: Enables understanding of word meanings based on context.
  2. Long-Distance Dependency Resolution: Can directly connect words that are far apart in a sentence.
  3. Parallel Processing: High computational efficiency due to simultaneous processing of all tokens.

Applications

Transformer-based models demonstrate exceptional performance in various natural language processing tasks including machine translation, text generation, and question answering. They form the foundation of modern AI models such as GPT and BERT.

With Claude

Data in AI DC

This image illustrates a data monitoring system for an AI data center server room. Titled “Data in AI DC Server Room,” it depicts the relationships between key elements being monitored in the data center.

The system consists of four main components, each with detailed metrics:

  1. GPU Workload – Right center
    • Computing Load: GPU utilization rate (%) and type of computational tasks (training vs. inference)
    • Power Consumption: Real-time power consumption of each GPU (W) – Example: NVIDIA H100 GPU consumes up to 700W
    • Workload Pattern: Periodicity of workload (peak/off-peak times) and predictability
    • Memory Usage: GPU memory usage patterns (e.g., HBM3 memory bandwidth usage)
  2. Power Infrastructure – Left
    • Power Usage: Real-time power output and efficiency of UPS, PDU, and transformers
    • Power Quality: Voltage, frequency stability, and power loss rate
    • Power Capacity: Types and proportions of supplied energy, ensuring sufficient power availability for current workload operations
  3. Cooling System – Right
    • Cooling Device Status: Air-cooling fan speed (RPM), liquid cooling pump flow rate (LPM), and coolant temperature (°C)
    • Environmental Conditions: Data center internal temperature, humidity, air pressure, and hot/cold zone temperatures – critical for server operations
    • Cooling Efficiency: Power Usage Effectiveness (PUE) and proportion of power consumed by the cooling system
  4. Server/Rack – Top center
    • Rack Power Density: Power consumption per rack (kW) – Example: GPU server racks range from 30 to 120 kW
    • Temperature Profile: Temperature (°C) of GPUs, CPUs, memory modules, and heat distribution
    • Server Status: Operational state of servers (active/standby) and workload distribution status

The workflow sequence indicated at the bottom of the diagram represents:

  1. ① GPU WORK: Initial execution of AI workloads – GPU computational tasks begin, generating system load
  2. ② with POWER USE: Increased power supply for GPU operations – Power demand increases with GPU workload, and power infrastructure responds accordingly
  3. ③ COOLING WORK: Cooling processes activated in response to heat generation
    • Sensing: Temperature sensors detect server and rack thermal conditions, monitoring hot/cold zone temperature differentials
    • Analysis: Analysis of collected temperature data, determining cooling requirements
    • Action: Adjustment of cooling equipment (fan speed, coolant flow rate, etc. automatically regulated)
  4. ④ SERVER OK: Maintenance of normal server operation through proper power supply and cooling – Temperature and power remain stable, allowing GPU workloads to continue running under optimal conditions

The arrows indicate data flow and interrelationships between systems, showing connections from power infrastructure to servers and from cooling systems to servers. This integrated system enables efficient and stable data center operation by detecting increased power demand and heat generation from GPU workloads, and adjusting cooling systems in real-time accordingly.

With Claude

Monitoring is from changes

Change-Based Monitoring System Analysis

This diagram illustrates a systematic framework for “Monitoring is from changes.” The approach demonstrates a hierarchical structure that begins with simple, certain methods and progresses toward increasingly complex analytical techniques.

Flow of Major Analysis Stages:

  1. One Change Detection:
    • The most fundamental level, identifying simple fluctuations such as numerical changes (5→7).
    • This stage focuses on capturing immediate and clear variations.
  2. Trend Analysis:
    • Recognizes data patterns over time.
    • Moves beyond single changes to understand the directionality and flow of data.
  3. Statistical Analysis:
    • Employs deeper mathematical approaches to interpret data.
    • Utilizes means, variances, correlations, and other statistical measures to derive meaning.
  4. Deep Learning:
    • The most sophisticated analysis stage, using advanced algorithms to discover hidden patterns.
    • Capable of learning complex relationships from large volumes of data.

Evolution Flow of Detection Processes:

  1. Change Detection:
    • The initial stage of detecting basic changes occurring in the system.
    • Identifies numerical variations that deviate from baseline values (e.g., 5→7).
    • Change detection serves as the starting point for the monitoring process and forms the foundation for more complex analyses.
  2. Anomaly Detection:
    • A more advanced form than change detection, identifying abnormal data points that deviate from general patterns or expected ranges.
    • Illustrated in the diagram with a warning icon, representing early signs of potential issues.
    • Utilizes statistical analysis and trend data to detect phenomena outside the normal range.
  3. Abnormal (Error) Detection:
    • The most severe level of detection, identifying actual errors or failures within the system.
    • Shown in the diagram with an X mark, signifying critical issues requiring immediate action.
    • May be classified as a failure when anomaly detection persists or exceeds thresholds.

Supporting Functions:

  • Adding New Relative Data: Continuously collecting relevant data to improve analytical accuracy.
  • Higher Resolution: Utilizing more granular data to enhance analytical precision.

This framework demonstrates a logical progression from simple and certain to gradually more complex analyses. The hierarchical structure of the detection process—from change detection through anomaly detection to error detection—shows how monitoring systems identify and respond to increasingly serious issues.

With Claude