

The Computing for the Fair Human Life.

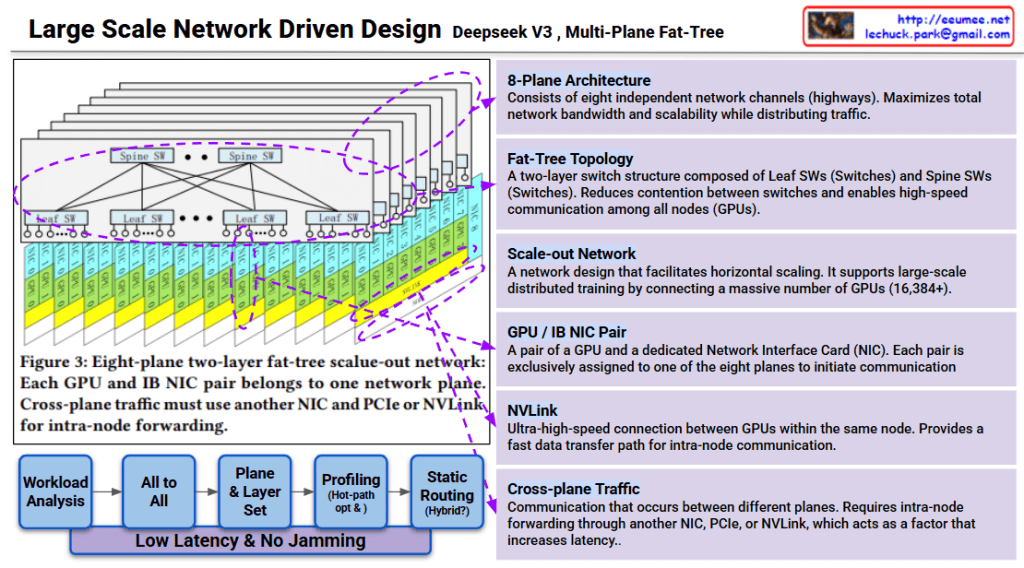
This image explains the Multi-Plane Fat-Tree network structure of Deepseek v3.
The workflow below minimizes latency and prevents network congestion:
Goal: Low latency & no jamming
This design is a scale-out network for large-scale distributed training supporting 16,384+ GPUs. Each plane operates independently to maximize overall system throughput.
Deepseek v3 uses an 8-plane fat-tree network architecture that connects 16,384+ GPUs through independent communication channels, minimizing contention and maximizing bandwidth. The two-layer switch topology (Spine and Leaf) combined with dedicated GPU-NIC pairs enables efficient traffic distribution across planes. Cross-plane traffic management and hot-path optimization ensure low-latency, high-throughput communication for large-scale AI training.
#DeepseekV3 #FatTreeNetwork #MultiPlane #NetworkArchitecture #ScaleOut #DistributedTraining #AIInfrastructure #GPUCluster #HighPerformanceComputing #NVLink #DataCenterNetworking #LargeScaleAI
With Claude
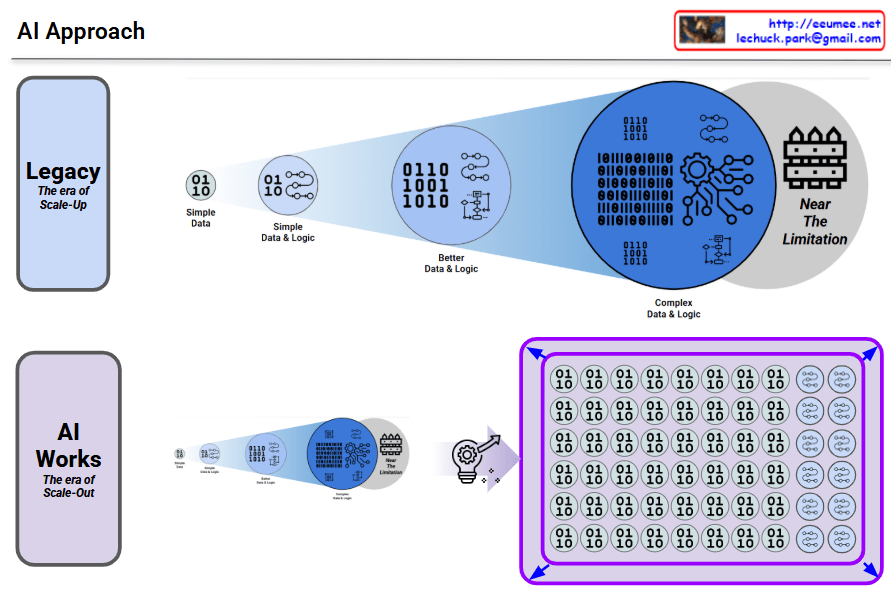
Traditional AI approach showing its limitations:
This approach gradually increases complexity, but no matter how much it improves, it inevitably runs into fundamental scalability limitations.
Modern AI transcending the limitations of the legacy approach through a new paradigm:
No matter how much you improve the legacy approach, there’s a ceiling. AI breaks through that ceiling with a completely different architecture.
#AI #MachineLearning #DeepLearning #NeuralNetworks #ScaleOut #Parallelization #AIRevolution #Paradigmshift #LegacyVsModern #AIArchitecture #TechEvolution #ArtificialIntelligence #ScalableAI #DistributedComputing #AIBreakthrough

LLM (Transformer) optimization requires more than just traditional optimization methodologies – new perspectives must be added.
Characteristics: Deterministic, logical approach
Characteristics: Physical performance improvement focus
Key Point: Statistical and Probabilistic Methodology
Key Point: Efficient parallel processing of large-scale matrix operations
| Domain | Traditional Method | LLM Additional Elements |
|---|---|---|
| SW | Algorithm, data structure optimization | + Probabilistic/statistical approach (human language/learning perspective) |
| HW | Function/speed optimization | + Massive parallel processing architecture |
For effective LLM optimization:
These three elements must be organically combined – this is the core message of the diagram.
LLM optimization requires integrating traditional deterministic SW/HW optimization with new paradigms: probabilistic/statistical approaches that mirror human language understanding and learning, plus hardware architectures designed for massive parallel processing. This represents a fundamental shift from conventional optimization, where human-centric probabilistic thinking and large-scale parallelism are not optional but essential dimensions.
#LLMOptimization #TransformerArchitecture #MachineLearningOptimization #ParallelProcessing #ProbabilisticAI #HumanLanguageView #GPUComputing #DeepLearningHardware #StatisticalML #AIInfrastructure #ModelOptimization #ScalableAI #NeuralNetworkOptimization #AIPerformance #ComputationalEfficiency
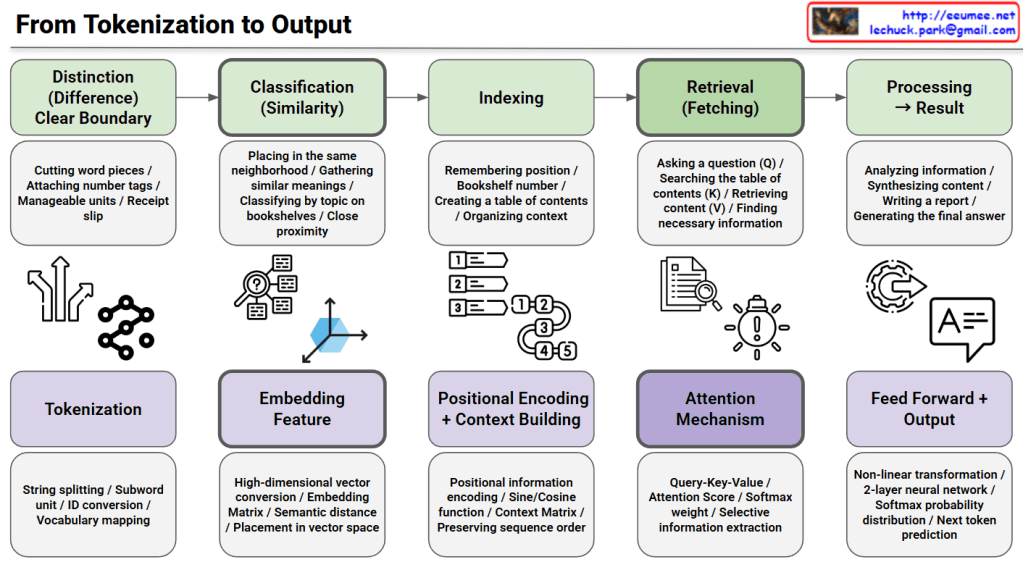
This image illustrates the complete process from tokenization to output in Natural Language Processing (NLP) and transformer models.
This diagram maps traditional information retrieval concepts to modern transformer architecture implementations. It visualizes how abstract concepts in the top row are realized through concrete technical implementations in the bottom row, providing an educational resource for understanding how models like GPT and BERT work internally at each stage.
This diagram explains the end-to-end pipeline of transformer models by mapping traditional information retrieval concepts (distinction, classification, indexing, retrieval, processing) to technical implementations (tokenization, embedding, positional encoding, attention mechanism, feed-forward output). The top row shows abstract conceptual stages while the bottom row reveals the actual neural network components used in models like GPT and BERT. It serves as an educational bridge between high-level understanding and low-level technical architecture.
#NLP #TransformerModels #DeepLearning #Tokenization #AttentionMechanism #MachineLearning #AI #NeuralNetworks #GPT #BERT #PositionalEncoding #Embedding #InformationRetrieval #ArtificialIntelligence #DataScience
With Claude
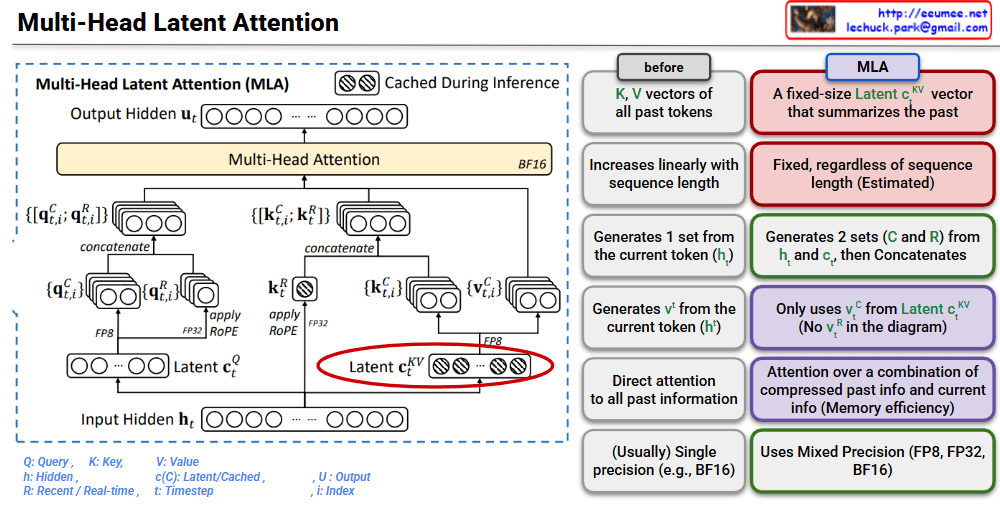
This image is a technical diagram explaining the structure of Multi-Head Latent Attention (MLA).
MLA is a mechanism that improves the memory efficiency of traditional Multi-Head Attention.
Traditional Approach:
MLA:
This architecture is an innovative approach to solve the KV cache memory problem during LLM inference.
MLA replaces the linearly growing KV cache with fixed-size latent vectors, dramatically reducing memory consumption during inference. It combines compressed past information with current token data through an efficient attention mechanism. This innovation enables faster and more memory-efficient LLM inference while maintaining model performance.
#MultiHeadLatentAttention #MLA #TransformerOptimization #LLMInference #KVCache #MemoryEfficiency #AttentionMechanism #DeepLearning #NeuralNetworks #AIArchitecture #ModelCompression #EfficientAI #MachineLearning #NLP #LargeLanguageModels
With Claude
