
The size of innovation is proportional to the number of failures
The Computing for the Fair Human Life.
The size of innovation is proportional to the number of failures
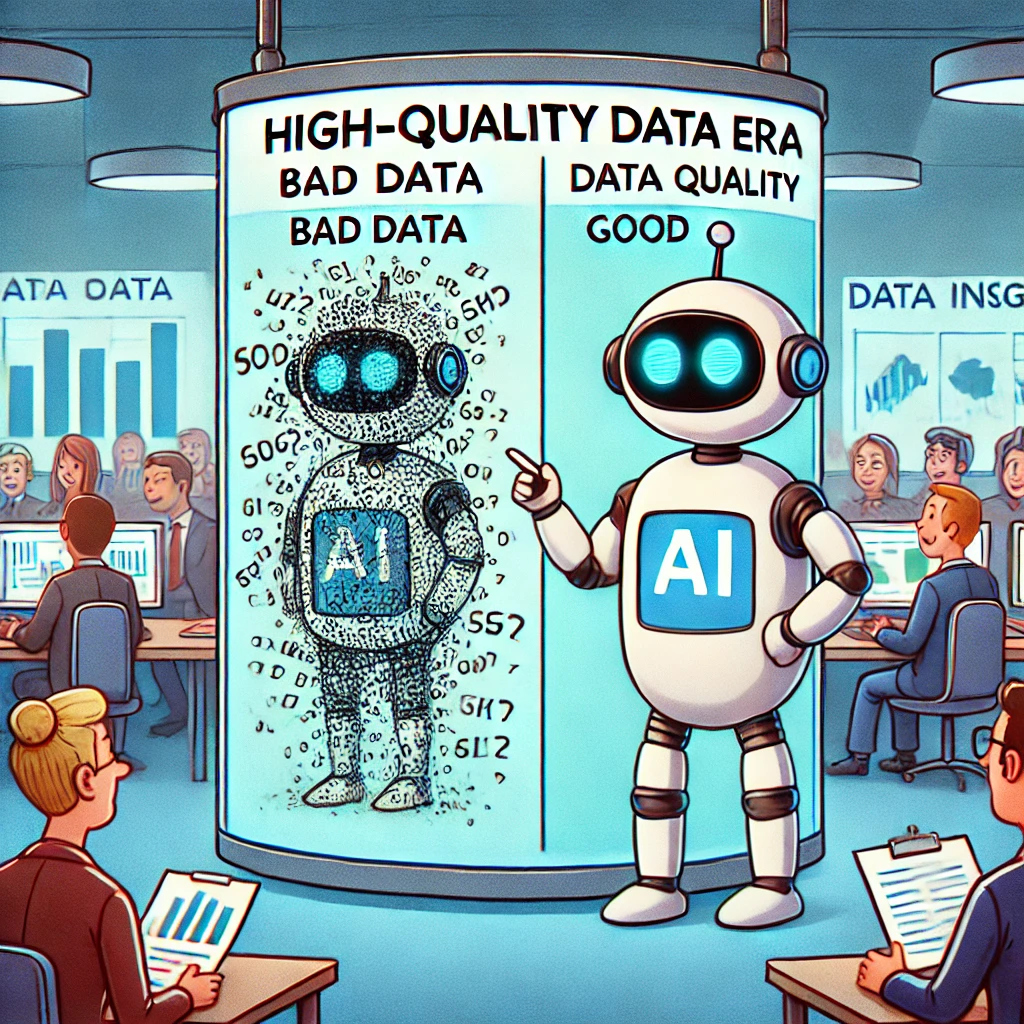
Data is the backbone of AI’s evolution.
AI’s success now depends on how well data is collected, processed, and managed. Companies and researchers must focus on high-quality data acquisition and refinement to stay ahead. 🚀
With ChatGPT

This diagram illustrates the differences between GPU and NPU from a deep learning perspective:
GPU (Graphic Process Unit):
NPU (Neuron Process Unit):
In conclusion, GPUs are responsible for processing enormous amounts of data and storing learning results in vector form, while NPUs specialize in the inference process of generating actual answers to questions based on this stored information. This relationship can be summarized as “training creates and stores vast amounts of data, while inference utilizes this at the point of need.”
With Claude
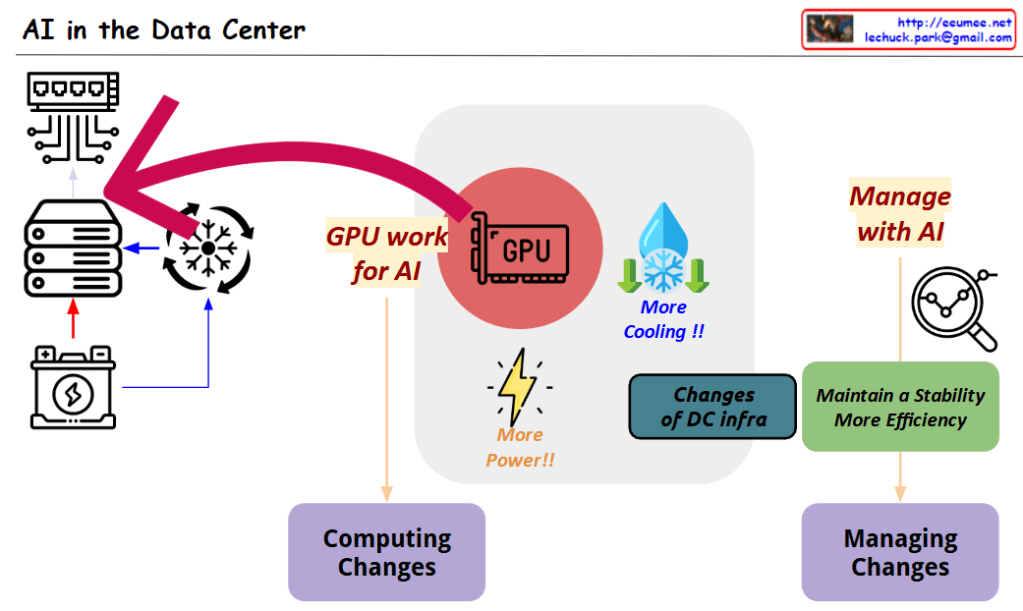
This diagram titled “AI in the Data Center” illustrates two key transformational elements that occur when AI technology is integrated into data centers:
These two changes are interconnected, visually demonstrating how AI technology not only revolutionizes the computing capabilities of data centers but also necessitates innovation in management approaches to effectively operate these advanced systems.
with Claude
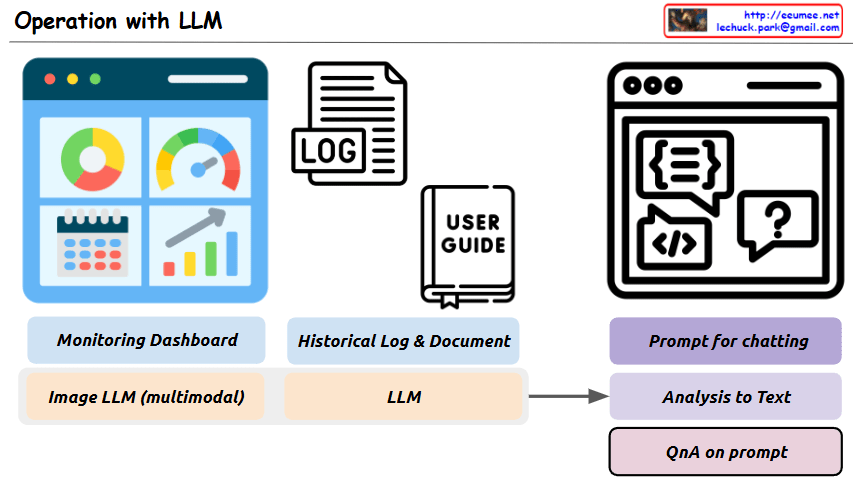
This image is a diagram titled “Operation with LLM,” showing a system architecture that integrates Large Language Models (LLMs) with existing operational technologies.
The main purpose of this system is to more efficiently analyze and solve various operational data and situations using LLMs.
Key components and functions:
This system aims to build an integrated operational environment where problems occurring in operational settings can be easily analyzed through LLM prompting and efficiently solved through a question-answer format.
With Claude
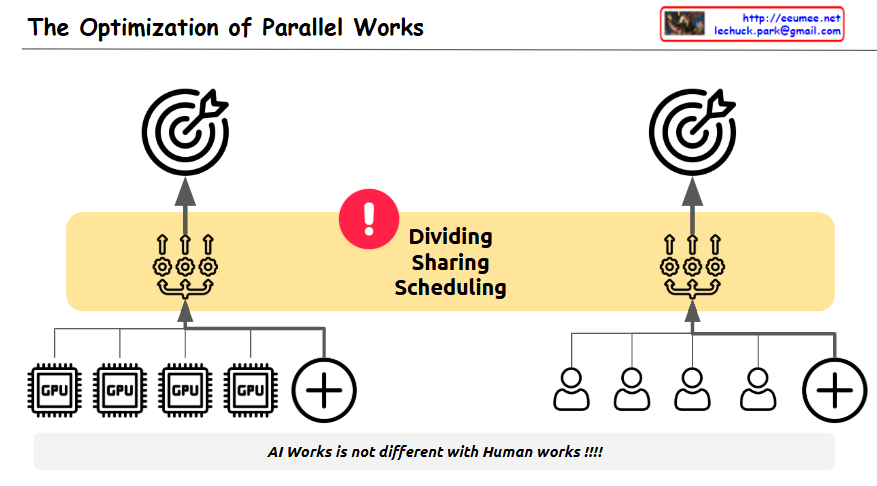
The image illustrates “The Optimization of Parallel Works,” highlighting the inherent challenges in optimizing parallel processing tasks.
The diagram cleverly compares two parallel systems:
The central yellow band emphasizes three critical challenges in both systems:
Each side shows a target/goal at the top, representing the shared objective that both computational and human systems strive to achieve.
The exclamation mark in the center draws attention to these challenges, while the message at the bottom states: “AI Works is not different with Human works!!!!” – emphasizing that the difficulties in coordinating independent processors toward a unified goal are similar whether we’re talking about computer processors or human teams.
The diagram effectively conveys that just as it’s difficult for people to work together toward a single objective, optimizing independent parallel processes in computing faces similar coordination challenges – requiring careful attention to division of labor, resource sharing, and timing to achieve optimal results.
With Claude

This diagram illustrates the cost structure of system implementation and operation, highlighting the following key concepts:
This diagram effectively visualizes the relationship between initial costs and long-term operational expenses, as well as the cost optimization strategy through automation.
With Claude
