Multi-DCs Operation with a LLM(3)

This diagram presents the 3 Core Expansion Strategies for Event Message-based LLM Data Center Operations System.

System Architecture Overview

Basic Structure:

  • Collects event messages from various event protocols (Log, Syslog, Trap, etc.)
  • 3-stage processing pipeline: Collector → Integrator → Analyst
  • Final stage performs intelligent analysis using LLM and AI

3 Core Expansion Strategies

1️⃣ Data Expansion (Data Add On)

Integration of additional data sources beyond Event Messages:

  • Metrics: Performance indicators and metric data
  • Manuals: Operational manuals and documentation
  • Configures: System settings and configuration information
  • Maintenance: Maintenance history and procedural data

2️⃣ System Extension

Infrastructure scalability and flexibility enhancement:

  • Scale Up/Out: Vertical/horizontal scaling for increased processing capacity
  • To Cloud: Cloud environment expansion and hybrid operations

3️⃣ LLM Model Enhancement (More Better Model)

Evolution toward DC Operations Specialized LLM:

  • Prompt Up: Data center operations-specialized prompt engineering
  • Nice & Self LLM Model: In-house development of DC operations specialized LLM model construction and tuning

Strategic Significance

These 3 expansion strategies present a roadmap for evolving from a simple event log analysis system to an Intelligent Autonomous Operations Data Center. Particularly, through the development of in-house DC operations specialized LLM, the goal is to build an AI system that achieves domain expert-level capabilities specifically tailored for data center operations, rather than relying on generic AI tools.

With Claude

go with : the best efficient

System Operations Strategy: Stabilize vs Optimize Analysis

Graph Components

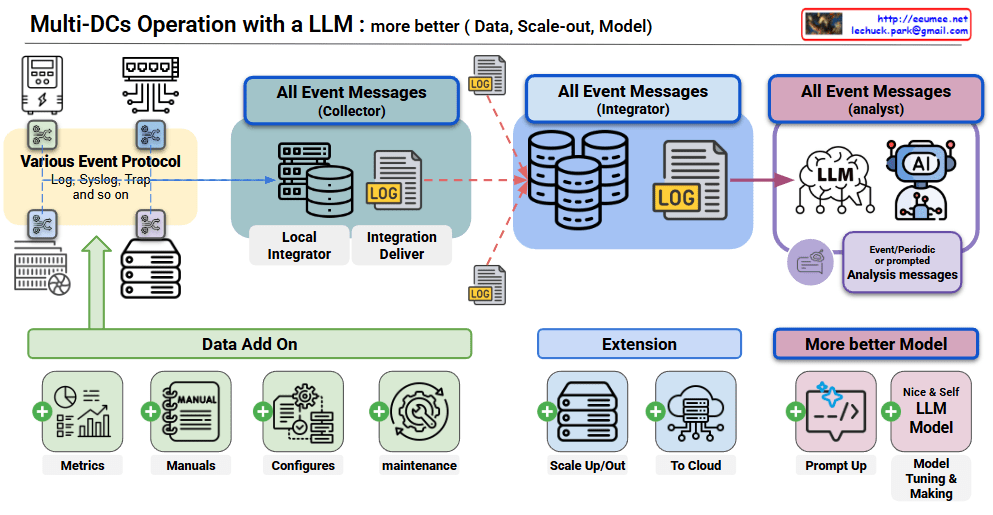
Operational Performance Levels (Color-coded meanings):

  • Blue Line: Risk Zone – Abnormal operational state requiring urgent intervention
  • Green Line: Stable and efficient ideal operational range
  • Purple Line: Enhanced high-performance operational state
  • Dark Red Line: Fully optimized peak performance state
  • Gray Line: Conservative stable operation (high cost consumption)

Core Operating Philosophy

Phase 1: Stabilize

Objective: keep <Green> higher than <Blue>

  • Meaning: Build defense mechanisms to prevent system from falling below risk zone (blue)
  • Impact: Prevent failures, ensure service continuity
  • Approach: Proactive response through predictive-based prevention, prioritizing stability

Phase 2: Optimize

Objective: move <Green> to <Red>

  • Meaning: Gradual performance improvement on a stabilized foundation
  • Impact: Simultaneous improvement of cost efficiency and operational performance
  • Approach: Pursue optimization within limits that don’t compromise stability

Strategic Insights

1. Importance of Sequential Approach

  • The Stabilize → Optimize sequence is essential
  • Direct optimization without stabilization increases risk exposure

2. Cost Efficiency Paradox

  • Stable efficiency (green) is practically more valuable than full optimization (red)
  • Excessive optimization can result in diminishing returns on investment

3. Dynamic Equilibrium Maintenance

  • Green zone represents a dynamic benchmark continuously adjusted upward, not a fixed target
  • Balance point between stability and efficiency must be continuously recalibrated based on environmental changes

Practical Implications

This model visualizes the core principle of modern system operations: “Stability is the prerequisite for efficiency.” Rather than pursuing performance improvements alone, it presents strategic guidelines for achieving genuine operational efficiency through gradual and sustainable optimization built upon a solid foundation of stability.

The framework emphasizes that true operational excellence comes not from aggressive optimization, but from maintaining the optimal balance between risk mitigation and performance enhancement, ensuring long-term business value creation through sustainable operational practices.

With Claude

CUDA Executive model

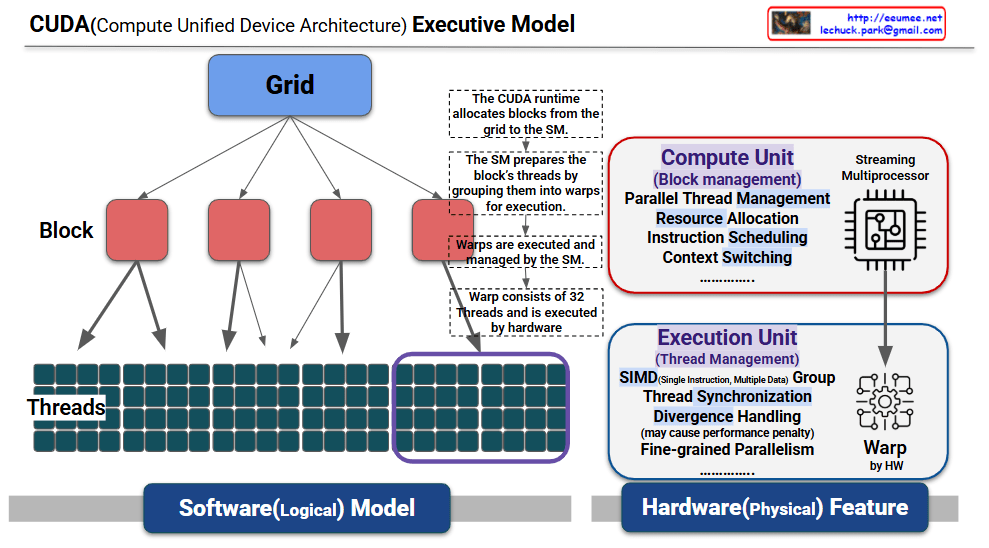
This is a structured explanation based on the provided CUDA (Compute Unified Device Architecture) execution model diagram. This diagram visually represents the relationship between the software (logical model) and hardware (physical device) layers in CUDA, illustrating the parallel processing mechanism step by step. The explanation reflects the diagram’s annotations and structure.


CUDA Executive Model Explanation

1. Software (Logical) Model

  • Grid:
  • The topmost layer of CUDA execution, defining the entire parallel workload. A grid consists of multiple blocks and is specified by the programmer during kernel launch (e.g., <<<blocksPerGrid, threadsPerBlock>>>).
  • Operation: The CUDA runtime allocates blocks from the grid to the Streaming Multiprocessors (SMs) on the GPU, managed dynamically by the global scheduler (e.g., GigaThread Engine). The annotation “The CUDA runtime allocates blocks from the grid to the SM, the grid prepares the block” clarifies this process.
  • Block:
  • Positioned below the grid, each block is a collection of threads. A block is assigned to a single SM for execution, with a maximum of 1024 threads per block (512 in some architectures).
  • Preparation: The SM prepares the block by grouping its threads into warps for execution, as noted in “The SM prepares the block’s threads by grouping them into warps for execution.”
  • Threads:
  • The smallest execution unit within a block, with multiple threads operating in parallel. Each thread is identified by a unique thread ID (threadIdx) and processes different data.
  • Grouping: The SM automatically organizes the block’s threads into warps of 32 threads each.

2. Hardware (Physical) Device

  • Streaming Multiprocessor (SM):
  • The core processing unit of the GPU, responsible for executing blocks. The SM performs the following roles:
    • Block Management: Handles blocks allocated by the CUDA runtime.
    • Parallel Thread Management: Groups threads into warps.
    • Resource Allocation: Assigns resources such as registers and shared memory.
    • Instruction Scheduling: Schedules warps for execution.
    • Context Switching: Supports switching between multiple warps.
  • Annotation: “The SM prepares the block’s threads by grouping them into warps for execution” highlights the SM’s role in thread organization.
  • Warp:
  • A hardware-managed execution unit consisting of 32 threads. Warps operate using the SIMT (Single Instruction, Multiple Thread) model, executing the same instruction simultaneously.
  • Characteristics:
    • Annotation: “Warp consists of 32 Threads and is executed by hardware” specifies the fixed warp size and hardware execution.
    • The SM’s warp scheduler manages multiple warps in parallel to hide memory latency.
  • Divergence: When threads within a warp follow different code paths (e.g., if-else), sequential execution occurs, potentially causing a performance penalty, as noted in “Divergence Handling (may cause performance penalty).”
  • Execution Unit:
  • The hardware component that executes warps, responsible for “Thread Management.” Key functions include:
    • SIMD Group: Processes multiple data with a single instruction.
    • Thread Synchronization: Coordinates threads within a warp.
    • Divergence Handling: Manages path divergences, which may impact performance.
    • Fine-grained Parallelism: Enables high-precision parallel processing.
  • Annotation: “Warps are executed and managed by the SM” indicates that the SM oversees warp execution.

3. Execution Flow

  • Step 1: Block Allocation:
  • The CUDA runtime dynamically allocates blocks from the grid to the SMs, as described in “The CUDA runtime allocates blocks from the grid to the SM.”
  • Step 2: Thread Grouping:
  • The SM groups the block’s threads into warps of 32 threads each to prepare for execution.
  • Step 3: Warp Execution:
  • The SM’s warp scheduler manages and executes the warps using the SIMT model, performing parallel computations. Divergence may lead to performance penalties.

4. Additional Information

  • Constraints: Warps are fixed at 32 threads and executed by hardware. The number of executable blocks and warps is limited by SM resources (e.g., registers, shared memory), though specific details are omitted.

Summary

This diagram illustrates the CUDA execution model by mapping the software layers (grid → block → threads) to the hardware (SM → warp). The CUDA runtime allocates blocks from the grid to the SM, the SM groups threads into warps for execution, and warps perform parallel computations using the SIMT model.


Work with Grok

Emergency Power System

This image shows a diagram of an Emergency Power System and the characteristics of each component.

Overall System Structure

At the top, the power grid is connected to servers/data centers, and three backup power options are presented in case of power supply interruption.

Three Backup Power Options

1. Generator

  • Long-term operation: Unlimited operation as long as fuel is available
  • Operation method: Engine rotation → Power generation
  • Type: Diesel engine generator
  • Disadvantages:
    • Start-up delay during instantaneous power outages
    • Start-up delay, noise, exhaust emissions
    • Periodic testing required
    • Requires integration with ATS (Automatic Transfer Switch)

2. Dynamic UPS

  • Features:
    • Uninterrupted/Long-term operation (until diesel engine starts)
    • Flywheel kinetic energy storage
    • Combined generator and diesel engine
  • Advantages: Seamless power supply without STS (Static Transfer Switch)
  • Disadvantages: High initial cost, large footprint, noise

DR (Diesel Rotary) UPS: A special form of Dynamic UPS that provides uninterrupted power through flywheel energy storage technology.

3. Static UPS

  • Operation time: Instantaneous/Short-term (typically 5-15 minutes)
  • Power quality: Clean power supply
  • Configuration: Battery(DC) → Inverter(AC) → Rectifier
  • Features:
    • Millisecond-level instant transfer
    • Battery life 3-5 years, replacement costs, heat generation issues

Key Characteristics Summary

Generators can operate long-term with fuel supply but have start-up delays, while Static UPS provides immediate power but only for short durations. Dynamic UPS (including DR UPS) is a hybrid solution that provides uninterrupted power through flywheel technology while enabling long-term operation when combined with diesel engines. In actual operations, it’s common to use these systems in combination, considering the advantages and disadvantages of each system.

With Claude

Memory Bound

This diagram illustrates the Memory Bound phenomenon in computer systems.

What is Memory Bound?

Memory bound refers to a situation where the overall processing speed of a computer is limited not by the computational power of the CPU, but by the rate at which data can be read from memory.

Main Causes:

  1. Large-scale Data Processing: Vast data volumes cause delays when loading data from storage devices (SSD/HDD) to DRAM
  2. Matrix Operations: Large matrices create delays in fetching data between cache, DRAM, and HBM (High Bandwidth Memory)
  3. Data Copying/Moving: Data transfer waiting times on the memory bus even within DRAM
  4. Cache Misses: When required data isn’t found in L1-L3 caches, causing slow main memory access to DRAM

Result

The Processing Elements (PEs) on the right have high computational capabilities, but the overall system performance is constrained by the slower speed of data retrieval from memory.

Summary:

Memory bound occurs when system performance is limited by memory access speed rather than computational power. This bottleneck commonly arises from large data transfers, cache misses, and memory bandwidth constraints. It represents a critical challenge in modern computing, particularly affecting GPU computing and AI/ML workloads where processing units often wait for data rather than performing calculations.

With Claude