Intelligent Event Analysis Framework ( Holistic Intelligent Diagnosis)

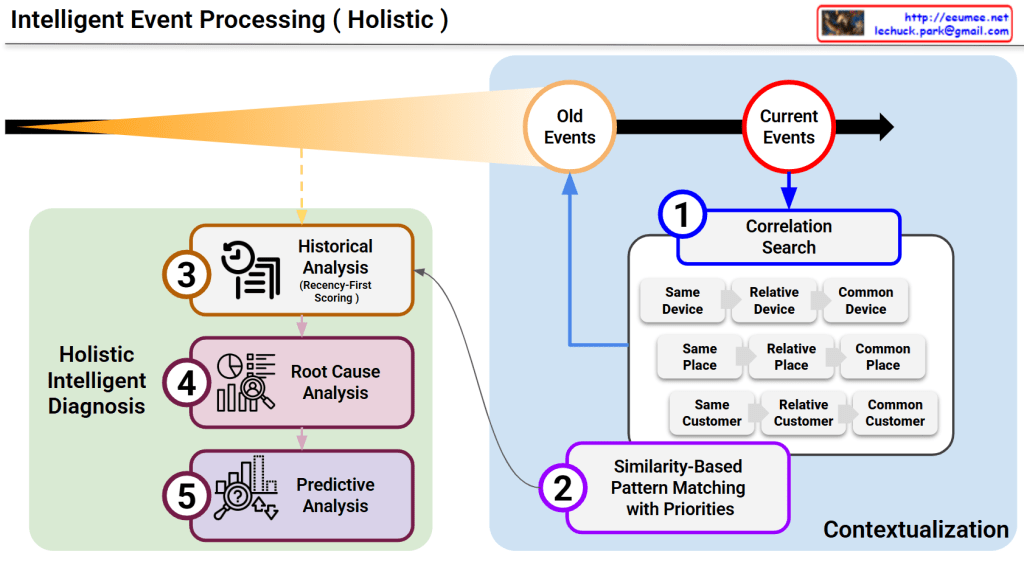
This diagram illustrates a sophisticated framework for Intelligent Event Processing, designed to provide a comprehensive, multi-layered diagnosis of system events. It moves beyond simple alerts by integrating historical context, spatial correlations, and future projections.

1. The Principle of Recency-First Scoring (Top Section)

The orange cone expanding toward the Current Events represents the Time-Decay or Recency-First Scoring model.

  • Weighted Importance: While “Old Events” are maintained for context, the system assigns significantly higher weight to the most recent data.
  • Sensitivity: This ensures the AI remains highly sensitive to emerging trends and immediate anomalies while naturally phasing out obsolete patterns.

2. Multi-Dimensional Correlation Search (Box 1)

When a current event is detected, the system immediately executes a Correlation Search across three primary dimensions to establish a spatial and logical context:

  • Device Context: Investigates if the issue is isolated to the same device, related devices, or common device types.
  • Spatial Context (Place): Analyzes if the event is tied to a specific location, a relative area (e.g., the same rack), or a common facility environment.
  • Customer Context: Checks for patterns across the same customer, relative accounts, or common customer profiles.

3. Similarity-Based Pattern Matching (Box 2)

By combining the results of the Correlation Search with the library of “Old Events,” the system performs Pattern Matching with Priorities.

  • This step identifies historical precedents that most closely resemble the current event’s “fingerprint.”
  • It functions similarly to Case-Based Reasoning (CBR), leveraging past solutions to address present challenges.

4. Holistic Intelligent Diagnosis (Green Box)

This is the core engine where three distinct analytical disciplines converge to create an actionable output:

  • ③ Historical Analysis: Utilizes the recency-weighted scores to understand the evolution of the current issue.
  • ④ Root Cause Analysis (RCA): Drills down into the underlying triggers to identify the “why” behind the event.
  • ⑤ Predictive Analysis: Projects the likely future trajectory of the event, allowing for proactive rather than reactive management.

Summary

For the platform, this diagram serves as the “brain” of the operation. It demonstrates how the agent doesn’t just see a single data point, but rather a “Holistic” picture that connects the dots across time, space, and causality.


#DataCenterOps #AI #EventProcessing #RootCauseAnalysis #PredictiveMaintenance #DataAnalytics #IntelligentDiagnosis #SystemMonitoring #TechInfrastructure

with Gemini

Intelligent Event Analysis Framework ( Who the First? )


Intelligent Event Processing System Overview

This architecture illustrates how a system intelligently prioritizes data streams (event logs) and selects the most efficient processing path—either for speed or for depth of analysis.

1. Importance Level Decision (Who the First?)

Events are categorized into four priority levels ($P0$ to $P3$) based on Urgency, Business Impact, and Technical Complexity.

  • P0: Critical (Immediate Awareness Required)
    • Criteria: High Urgency + High Business Impact.
    • Scope: Core service interruptions, security breaches, or life-safety/facility emergencies (e.g., fire, power failure).
  • P1: Urgent (Deep Diagnostics Required)
    • Criteria: High Technical Complexity + High Business Impact.
    • Scope: VIP customer impact, anomalies with high cascading risk, or complex multi-system errors.
  • P2: Normal (Routine Analysis Required)
    • Criteria: High Technical Complexity + Low Business Impact.
    • Scope: General performance degradation, intermittent errors, or new patterns detected after hardware deployment.
  • P3: Info (Standard Logging)
    • Criteria: Low Technical Complexity + Low Business Impact.
    • Scope: General health status logs or minute telemetry changes within designed thresholds.

2. Processing Paths: Fast Path vs. Slow Path

The system routes events through two different AI-driven pipelines to balance speed and accuracy.

A. Fast Path (Optimized for P0)

  • Workflow: Symbolic Engine → Light LLM → Fast Notification.
  • Goal: Minimizes latency to provide Immediate Alerts for critical issues where every second counts.

B. Slow Path (Optimized for P1 & P2)

  • Workflow: Bigger Engine → Heavy LLM + RAG (Retrieval-Augmented Generation) + CoT (Chain of Thought).
  • Goal: Delivers high-quality Root Cause Analysis (RCA) and detailed Recovery Guides for complex problems requiring deep reasoning.

Summary

  1. The system automatically prioritizes event logs into four levels (P0–P3) based on their urgency, business impact, and technical complexity.
  2. It bifurcates processing into a Fast Path using light models for instant alerting and a Slow Path using heavy LLMs/RAG for deep diagnostics.
  3. This dual-track approach maximizes operational efficiency by ensuring critical failures are reported instantly while complex issues receive thorough AI-driven analysis.

#AIOps #IntelligentEventProcessing #LLM #RAG #SystemMonitoring #IncidentResponse #ITAutomation #CloudOperations #RootCauseAnalysis

With Gemini

Predictive Count/Resolve Time for .


the “Predictive Count/Resolve Time” Diagram

This diagram illustrates the workflow of IT Operations or System Maintenance, specifically comparing Predictive Maintenance (Proactive) versus Recovery/Reactive (Reactive) processes.

It is divided into two main flows: the Preventive Flow (Left) and the Reactive Flow (Right).

1. Left Flow: Predictive Maintenance

This represents the ideal process where anomalies are detected and addressed before a full system failure occurs.

  • Process:
    • Work Changes / Monitoring: Routine operations and continuous system monitoring.
    • Anomaly: The system exhibits abnormal patterns, but it hasn’t failed yet.
    • Detection (Awareness): Monitoring tools or operators detect this anomaly.
    • Predictive Maintenance: Maintenance is performed proactively to prevent the fault.
  • Key Performance Indicators (KPIs):
    • Count: The number of times predictive maintenance was performed.
    • PTM Success Rate: A metric to measure success (e.g., considered successful if no disability/failure occurs within 14 days after the predictive maintenance).

2. Right Flow: Reactive Recovery

This is the response process when an anomaly is missed, leading to an actual system failure.

  • Process:
    • Abnormal → Alert: The condition worsens, triggering an alert. The time taken to reach this point is MTTD (Mean Time To Detect).
    • Fault Down: The system actually fails or goes down.
    • Propagation Time (to Experts): The time it takes to escalate the issue to the right experts. This relates to MTTE (Mean Time To Engage Expert).
    • Recovery Time: The time taken by experts to fix the issue.
  • Key Performance Indicators (KPIs):
    • MTTR (Mean Time To Resolve/Repair): The total time from the failure (Fault Down) until the system is fully recovered. Reducing this time is a critical operational goal.

3. Summary & Key Takeaway

The diagram visually emphasizes the importance of “preventing issues before they happen (Left)” rather than “fixing them after they break (Right).”

  • Flow Logic: If an ‘Anomaly’ is successfully ‘Detected’, it leads to ‘Predictive Maintenance’. If missed, it escalates to ‘Abnormal’ and results in a ‘Fault Down’.
  • Goal: The objective is to minimize MTTR (downtime) on the right side and increase the PTM Count (proactive prevention) on the left side to ensure high system availability.

#DevOps #SRE #PredictiveMaintenance #MTTR #IncidentManagement #ITOperations #SystemMonitoring #DisasterRecovery #MTTD #TechMaintenance

With Gemini

Time Constant(Delay of the sensor)

Image Interpretation: System Problems Due to Sensor Delay

This diagram explains system performance issues caused by the Time Constant (delay) of temperature sensors.

Top Section: Two Workload Scenarios

LLM Workload (AI Tasks)

  • Runs at 100% workload
  • Almost no delay (No Delay almost)
  • Result: Performance Down and Workload Cost waste

GPU Workload

  • Operating at 80°C
  • Thermal Throttling occurs
  • Transport Delay exists
  • Performance degradation starts at 60°C → Step down

Bottom Section: Core of the Sensor Delay Problem

Timeline:

  1. Sensor UP start (Temperature Sensor activation)
    • Big Delay due to Time Constant
  2. TC63 (After 10-20 seconds)
    • Sensor detects 63% temperature rise
    • Actual temperature is already higher
  3. After 30-40 seconds
    • Sensor detects 86% rise
    • Temperature Divergence, Late Cooling problem occurs

Key Issues

Due to the sensor’s Time Constant delay:

  • Takes too long to detect actual temperature rise
  • Cooling system activates too late
  • GPU already overheated, causing thermal throttling
  • Results in workload cost waste and performance degradation

Summary

Sensor delays create a critical gap between actual temperature and detected temperature, causing cooling systems to react too late. This results in GPU thermal throttling, performance degradation, and wasted computational resources. Real-time monitoring with fast-response sensors is essential for optimal system performance.


#ThermalManagement #SensorDelay #TimeConstant #GPUThrottling #DataCenter #PerformanceOptimization #CoolingSystem #AIWorkload #SystemMonitoring #HardwareEngineering #ThermalThrottling #LatencyChallenges #ComputeEfficiency #ITInfrastructure #TemperatureSensing

With Claude