GPU Server Room : Changes

Image Overview

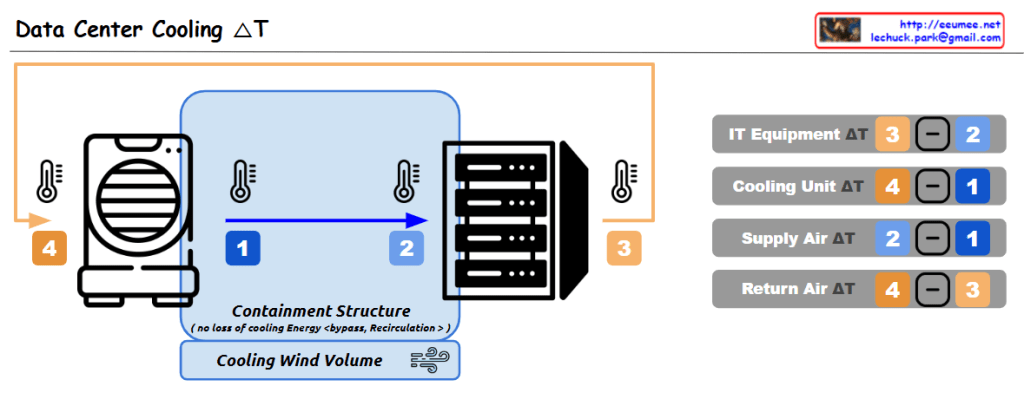
This dashboard displays the cascading resource changes that occur when GPU workload increases in an AI data center server room monitoring system.

Key Change Sequence (Estimated Values)

  1. GPU Load Increase: 30% → 90% (AI computation tasks initiated)
  2. Power Consumption Rise: 0.42kW → 1.26kW (3x increase)
  3. Temperature Delta Rise: 7°C → 17°C (increased heat generation)
  4. Cooling System Response:
    • Water flow rate: 200 LPM → 600 LPM (3x increase)
    • Fan speed: 600 RPM → 1200 RPM (2x increase)

Operational Prediction Implications

  • Operating Costs: Approximately 3x increase from baseline expected
  • Spare Capacity: 40% cooling system capacity remaining
  • Expansion Capability: Current setup can accommodate additional 67% GPU load

This AI data center monitoring dashboard illustrates the cascading resource changes when GPU workload increases from 30% to 90%, triggering proportional increases in power consumption (3x), cooling flow rate (3x), and fan speed (2x). The system demonstrates predictable operational scaling patterns, with current cooling capacity showing 40% remaining headroom for additional GPU load expansion. Note: All values are estimated figures for demonstration purposes.

Note: All numerical values are estimated figures for demonstration purposes and do not represent actual measured data.

With Claude

DC Cooling (delta)T

From Claude with some prompting
This data center cooling system utilizes a containment structure to control the airflow around the IT equipment, which helps improve cooling efficiency. The cooled air is supplied to the equipment, and the warmer exhaust air is expelled outside.

The key aspect of this system is the monitoring of temperature differences (ΔT) between the various components, which enables the following analyses and improvements:

  1. IT Equipment ΔT (3 – 2): This represents the temperature rise across the IT equipment itself, indicating the amount of heat generated by the IT hardware. Analyzing this can help identify opportunities to improve the efficiency of the IT equipment, such as through layout optimization or hardware upgrades.
  2. Cooling Unit ΔT (4 – 1): This is the temperature difference across the cooling unit, where the air is cooled. A smaller ΔT indicates higher efficiency of the cooling unit. Monitoring this metric allows for continuous evaluation and optimization of the cooling unit’s performance.
  3. Supply Air ΔT (2 – 1): This is the temperature change of the cooled air as it is supplied into the data center. A smaller ΔT here suggests the cooled air is being effectively distributed.
  4. Return Air ΔT (4 – 3): This is the temperature rise of the air as it is returned from the data center. A larger ΔT indicates the cooling system is effectively removing more heat from the data center.

These temperature difference data points are crucial baseline information for evaluating and improving the overall efficiency of the data center cooling system. By continuously monitoring and analyzing these metrics, the facility can optimize energy usage, cooling costs, and system reliability.

TSDB flow for alerts

From Claude with some prompting
This image illustrates the flow and process of a Time Series Database (TSDB) system. The main components are:

Time Series Data: This is the input data stream containing time-stamped values from various sources or metrics.

Counting: It performs change detection on the incoming time series data to capture relevant events or anomalies.

Delta Value: The difference or change observed in the current value compared to a previous reference point, denoted as NOW() – previous value.

Time-series summary Value: Various summary statistics like MAX, MIN, and other aggregations are computed over the time window.

Threshold Checking: The delta values and other aggregations are evaluated against predefined thresholds for anomaly detection.

Alert: If any threshold conditions are violated, an alert is triggered to notify the monitoring system or personnel.

The process also considers correlations with other metrics for improved anomaly detection context. Additionally, AI-based techniques can derive new metrics from the existing data for enhanced monitoring capabilities.

In summary, this flow diagram represents the core functionality of a time series database focused on capturing, analyzing, and alerting on anomalies or deviations from expected patterns in real-time data streams.

Event & Alarm

From DALL-E with some prompting

The image illustrates the progressive stages of detecting alarm events through data analysis. Here’s a summary:

  1. Internal State: It shows a machine with an ‘ON/OFF’ state, indicating whether the equipment is currently operating.
  2. Numeric & Threshold: A numeric value is monitored against a set threshold, which can trigger an alert if exceeded.
  3. Delta (Changes) & Threshold: A representation of an alert triggered by significant changes or deviations in the equipment’s performance, as compared to a predefined threshold.
  4. Time Series & Analysis: This suggests that analyzing time-series data can identify trends and forecast potential issues.
  5. Machine Learning: Depicts the use of machine learning to interpret data and build predictive models.
  6. More Predictive: The final stage shows the use of machine learning insights to anticipate future events, leading to a more sophisticated alarm system.

Overall, the image conveys the evolution of alarm systems from basic monitoring to advanced prediction using machine learning.