The Start of Operation and Automation

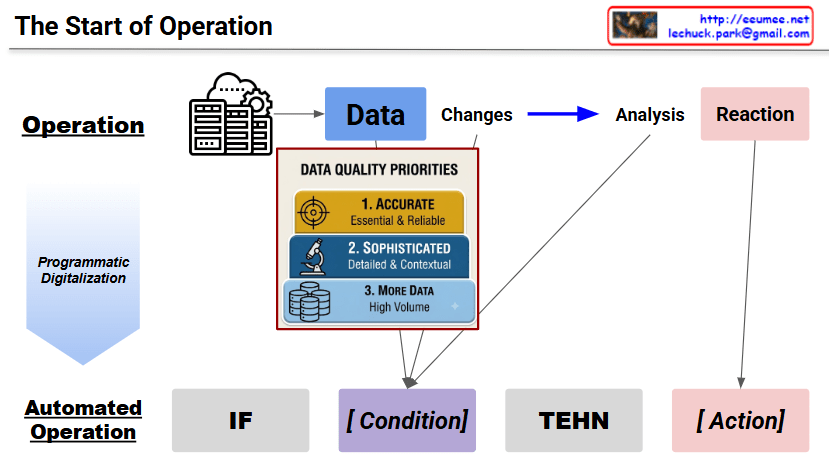
This image, titled “The Start of Operation,” visually maps out the “Programmatic Digitalization” process. It illustrates how a standard, manual “Operation” transitions into an “Automated Operation.”

Detailed Description:

  • Top Layer – Operation Phase:
    • The workflow begins with “Data” sourced from servers and cloud infrastructure (represented by the icons on the left).
    • This data flows through “Changes,” follows a blue arrow into “Analysis,” and finally results in a “Reaction.”
  • Data Quality Priorities:
    • An embedded box under “Data” highlights a specific hierarchy of data importance.
    • Priority 1: ACCURATE – Emphasizes that data must be essential and reliable (Target icon).
    • Priority 2: SOPHISTICATED – Data should be detailed and contextual (Microscope icon).
    • Priority 3: MORE DATA – Refers to a high volume of data (Database icon).
  • Bottom Layer – Automated Operation Phase:
    • The upper processes are translated into a foundational programming logic: “IF-THEN” (Note: “THEN” is slightly misspelled as “TEHN” in the image).
    • Arrows pointing down from “Data” (including the priority box), “Changes,” and “Analysis” all converge into the “[Condition]” box. This shows that quality data and its subsequent analysis form the “IF” criteria.
    • An arrow from the top layer’s “Reaction” points directly down to the “[Action]” box. This indicates that once the condition is met (THEN), an automated response is executed.

Summary: This diagram outlines the architectural logic behind automating business or system operations through digitalization. It demonstrates that defining a precise “IF Condition” relies entirely on high-quality data (prioritizing accuracy, sophistication, and volume) and thorough analysis. Once these conditions are met, they seamlessly trigger a pre-determined, automated “THEN Action.”

#DataAutomation #DigitalTransformation #DataQuality #ConditionalLogic #ProgrammaticDigitalization

WIth Gemini
Road to the Automation

Diagram Description: The Paradigm Shift to Autonomous Operations

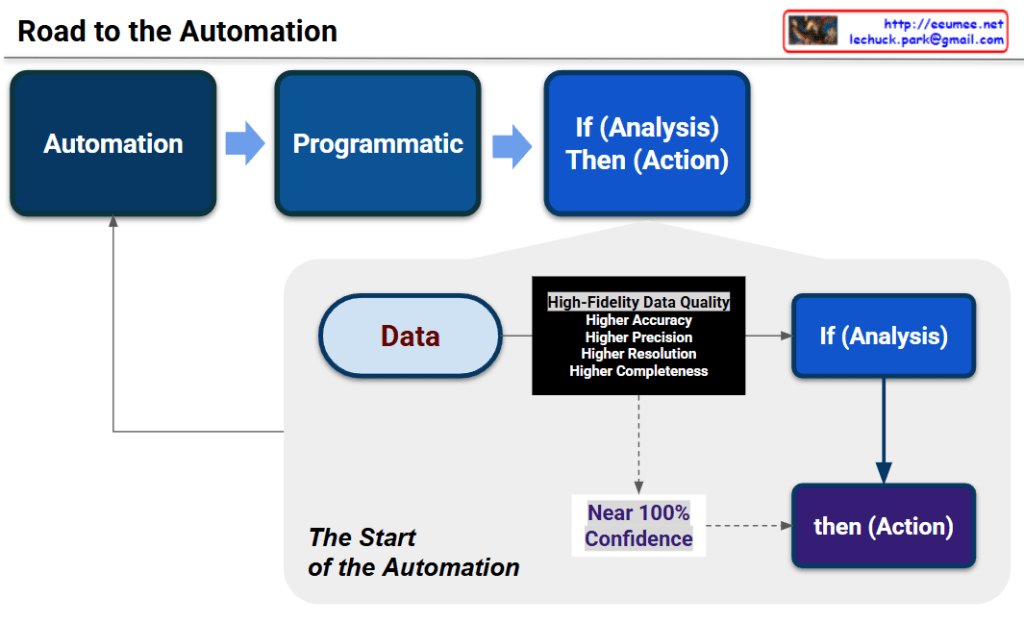
This infographic, titled “Road to the Automation,” visually explains the evolution from traditional, rule-based automation to a highly reliable, data-driven autonomous architecture.

  • The Traditional Approach (Top Flow):The upper section outlines the conventional path of automation. It transitions from a general “Automation” state to a “Programmatic” structure, ultimately relying on a standard, predefined logic: “If (Analysis) Then (Action).” This represents a system that reacts based on statically programmed rules.
  • The Start of True Automation (Bottom Flow):The core philosophy of the diagram lies in the lower, shaded area labeled “The Start of the Automation.” It asserts that true autonomous operation does not start with logic, but with “Data.”
    • The Quality Gate: The raw data must meet a strict standard of “High-Fidelity Data Quality,” which is defined by a comprehensive, four-pillar framework: Higher Accuracy, Higher Precision, Higher Resolution, and Higher Completeness.
    • Generating Systemic Trust: As the high-fidelity data feeds into the “If (Analysis)” phase, it concurrently establishes “Near 100% Confidence.”
    • Triggering Safe Action: This near-perfect confidence level is the critical catalyst. It provides the necessary systemic trust to safely execute the “then (Action).” This implies that a system can only act autonomously and safely when the underlying data quality eliminates uncertainty.
  • The Continuous Loop:Finally, an arrow points from the bottom automated framework back to the initial “Automation” block, illustrating a feedback loop. It shows that high-quality, confidence-backed autonomous actions are what continuously elevate and refine the entire automation ecosystem.

#AIOps #DataQuality #AutonomousSystems #InfrastructureAutomation #HighFidelityData #DataDriven #TechVisualization

2 Key Points For Digitalizations

2 Key Points For Digitalizations

This diagram illustrates two essential elements for successful digital transformation.

1️⃣ Data Quality

“High Precision & High Resolution”

The left section shows the data collection and quality management phase:

  • Facility/Device: Physical infrastructure including servers, networks, power systems, and cooling equipment
  • Data Generator: Generates data from various sources
  • 3T Process:
    • Performance: Data collection and measurement
    • Transform: Data processing and standardization
    • Transfer: Data movement and delivery

The key is to secure high-quality data with high precision and resolution.

2️⃣ Fast & Accurate Data Correlation

“Rapid Data Correlation Analysis with AI”

The right section represents the data utilization phase:

  • Data Storing: Systematic storage in various types of databases
  • Monitoring: Real-time system surveillance and alerts
  • Analysis: In-depth data analysis and insight extraction

The ultimate goal is to quickly and accurately identify correlations between data using AI.

Core Message

The keys to successful digitalization are:

  1. Input Stage: Accurate and detailed data collection
  2. Output Stage: Fast and precise AI-based analysis

True digital transformation becomes possible when these two elements work in harmony.


Summary

✅ Successful digitalization requires two pillars: high-quality data input (high precision & resolution) and intelligent output (AI-driven analysis).

✅ The process flows from facility infrastructure through data generation, the 3T transformation (Performance-Transform-Transfer), to storage, monitoring, and analysis.

✅ When quality data collection meets fast AI correlation analysis, organizations achieve meaningful digital transformation and actionable insights.

#DigitalTransformation #DataQuality #AIAnalysis #DataCorrelation #HighPrecisionData #BigData #DataDriven #Industry40 #SmartFactory #DataInfrastructure #DigitalStrategy #AIInsights #DataManagement #TechInnovation #EnterpriseIT

With Claude