Data is the next of the AI

Data is the backbone of AI’s evolution.

Summary 🚀

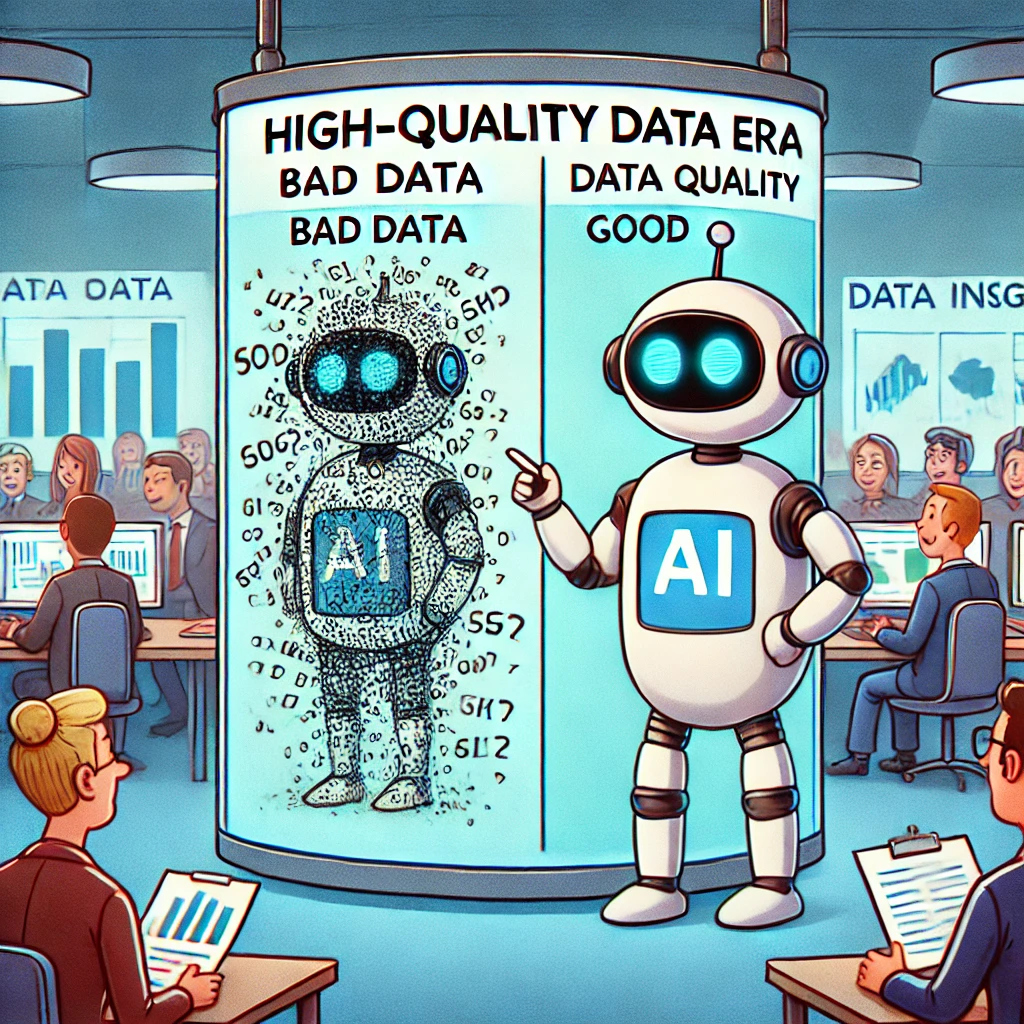
  1. High-quality data is the key to the AI era.
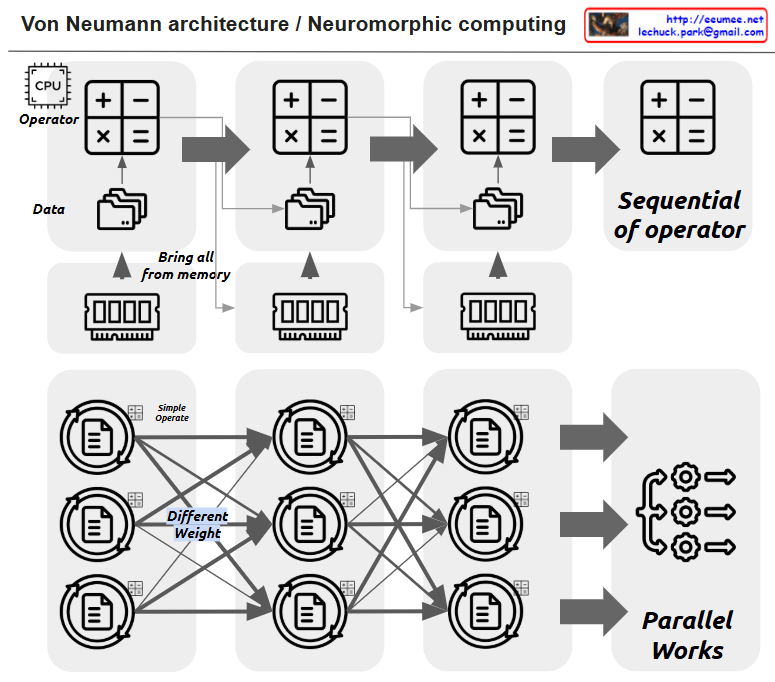
    • Infrastructure has advanced, but accurate and structured data is essential for building effective AI models.
    • Garbage In, Garbage Out (GIGO) principle: Poor data leads to poor AI performance.
  2. Characteristics of good data
    • High-resolution data: Provides precise information.
    • Clear labeling: Enhances learning accuracy.
    • Structured data: Enables efficient AI processing.
  3. Data is AI’s core competitive advantage.
    • Domain-specific datasets define AI performance differences.
    • Data cleaning and quality management are essential.
  4. Key messages
    • “Data is the backbone of AI’s evolution.”
    • “Good data fuels great AI!”

Conclusion

AI’s success now depends on how well data is collected, processed, and managed. Companies and researchers must focus on high-quality data acquisition and refinement to stay ahead. 🚀

With ChatGPT

Add with power

Add with Power: 8-Bit Binary Addition and Energy Transformation

Core Mechanism:

  1. Input: Two 8-energy binary states (both rows ending with 1)
  2. Computation Process: 1+1 = 2 (binary overflow occurs)
  3. Result:
    • Output row’s last bit changed to 0
    • Part of energy converted to heat

Key Components:

  • Two input rows with 8 binary “energies”
  • Computing symbol (+) representing addition
  • A heat generation (?) box marked x8
  • Resulting output row with modified energy state

Fundamental Principle: “All energies must be maintained with continuous energies for no error (no changes without Computing)”

This diagram illustrates:

  • Binary addition process
  • Energy conservation and transformation
  • Information loss during computation
  • Relationship between computation, energy, and heat generation

The visual representation shows how a simple 8-bit addition triggers energy transfer, with overflow resulting in heat production and a modified binary state.

WIth Claude

Digital Twin and the LLM

Digital Twin Concept

A Digital Twin is composed of three key elements:

  • High Precision Data: Exact, structured numerical data
  • Real 3D Model: Visual representation that is easy to comprehend
  • History/Prediction Simulation: Temporal analysis capabilities

LLM Approach

Large Language Models expand on the Digital Twin concept with:

  • Enormous Unstructured Data: Ability to incorporate and process diverse, non-structured information
  • Text-based Interface: Making analysis more accessible through natural language rather than requiring visual interpretation
  • Enhanced Simulation: Improved predictive capabilities leveraging more comprehensive datasets

Key Advantages of LLM over Traditional Digital Twin

  1. Data Flexibility: LLMs can handle both structured and unstructured data, expanding beyond the limitations of traditional Digital Twins
  2. Accessibility: Text-based interfaces lower the barrier to understanding complex analyses
  3. Implementation Efficiency: Recent advances in LLM and GPU technologies make these solutions more practical to implement than complex Digital Twin systems
  4. Practical Application: LLMs offer a more approachable alternative while maintaining the core benefits of Digital Twin concepts

This comparison illustrates how LLMs can serve as an evolution of Digital Twin technology, providing similar benefits through more accessible means and potentially expanding capabilities through their ability to process diverse data types.

With Claude

Human, Data,AI

The Key stages in human development:

  1. The Start (Humans)
  • Beginning of human civilization and knowledge accumulation
  • Formation of foundational civilizations
  • Human intellectual capacity and creativity as key drivers
  • The foundation for all future developments
  1. The History Log (Data)
  • Systematic storage and management of accumulated knowledge
  • Digitalization of information leading to quantitative and qualitative growth
  • Acceleration of knowledge sharing and dissemination
  • Bridge between human intelligence and artificial intelligence
  1. The Logic Calculation (AI)
  • Logical computation and processing based on accumulated data
  • New dimensions of data utilization through AI technology
  • Automated decision-making and problem-solving through machine learning and deep learning
  • Represents the current frontier of human technological achievement

What’s particularly noteworthy is the exponential growth curve shown in the graph. This exponential pattern indicates that each stage builds upon the achievements of the previous one, leading to accelerated development. The progression from human intellectual activity through data accumulation and management, ultimately leading to AI-driven innovation, shows a dramatic increase in the pace of advancement.

This developmental process is significant because:

  • Each stage is interconnected rather than independent
  • Previous stages form the foundation for subsequent developments
  • The rate of progress increases exponentially over time
  • Each phase represents a fundamental shift in how we process and utilize information

This timeline effectively illustrates how human civilization has evolved from basic knowledge creation to data management, and finally to AI-powered computation, with each stage marking a significant leap in our technological and intellectual capabilities.

With Claude

Analysis Evolutions and ..

With Claude
this image that shows the evolution of data analysis and its characteristics at each stage:

Analysis Evolution:

  1. 1-D (One Dimensional): Current Status analysis
  2. Time Series: Analysis of changes over time
  3. n-D Statistics: Multi-dimensional correlation analysis
  4. ML/DL (Machine Learning/Deep Learning): Huge-dimensional analysis including exceptions

Bottom Indicators’ Changes:

  1. Data/Computing/Complexity:
  • Marked as “Up and Up” and increases “Dramatically” towards the right
  1. Accuracy:
  • Left: “100% with no other external conditions”
  • Right: “not 100%, up to 99.99% from all data”
  1. Comprehensibility:
  • Left: “Understandable/Explainable”
  • Right: “Unexplainable”
  1. Actionability:
  • Left: “Easy to Action”
  • Right: “Difficult to Action require EXP” (requires expertise)

This diagram illustrates the trade-offs in the evolution of data analysis. As analysis methods progress from simple one-dimensional analysis to complex ML/DL, while the sophistication and complexity of analysis increase, there’s a decrease in comprehensibility and ease of implementation. It shows how more advanced analysis techniques, while powerful, require greater expertise and may be less transparent in their decision-making processes.

The progression also demonstrates how modern analysis methods can handle increasingly complex data but at the cost of reduced explainability and the need for specialized knowledge to implement them effectively.

Von Neumann architecture / Neuromorphic computing

With Claude
This image illustrates the comparison between Von Neumann architecture and Neuromorphic computing.

The upper section shows the traditional Von Neumann architecture:

  1. It has a CPU (Operator) that processes basic operations (+, -, ×, =) sequentially
  2. Data is brought from memory (“Bring all from memory”) and processed in sequence
  3. All operations are performed sequentially (“Sequential of operator”)

The lower section demonstrates Neuromorphic computing:

  1. It shows a neural network structure where multiple nodes are interconnected
  2. Each connection has different weights (“Different Weight”) and performs simple operations (“Simple Operate”)
  3. All operations are processed in parallel (“Parallel Works”)

Key differences between these architectures:

  • Von Neumann architecture: Sequential processing, centralized computation
  • Neuromorphic computing: Parallel processing, distributed computation, design inspired by the human brain’s structure

The main advantage of Neuromorphic computing is that it provides a more efficient architecture for artificial intelligence and machine learning tasks by mimicking the biological neural networks found in nature. This parallel processing approach can handle complex computational tasks more efficiently than traditional sequential processing in certain applications.

The image effectively contrasts how data flows and is processed in these two distinct computing paradigms – the linear, sequential nature of Von Neumann versus the parallel, interconnected nature of Neuromorphic computing.

One Value to Value(s)

With Claude
“A Framework for Value Analysis: From Single Value to Comprehensive Insights”

This diagram illustrates a sophisticated analytical framework that shows how a single value transforms through various analytical processes:

  1. Time Series Analysis Path:
    • A single value evolves over time
    • Changes occur through two mechanisms:
      • Self-generated changes (By oneself)
      • External influence-driven changes (By influence)
    • These changes are quantified through a mathematical function f(x)
    • Statistical measures (average, minimum, maximum, standard deviation) capture the characteristics of these changes
  2. Correlation Analysis Path:
    • The same value is analyzed for relationships with other relevant data
    • Weighted correlations indicate the strength and significance of relationships
    • These relationships are also expressed through a mathematical function f(x)
  3. Integration and Machine Learning Stage:
    • Both analyses (time series and correlation) feed into advanced analytics
    • Machine Learning and Deep Learning algorithms process this dual-perspective data
    • The final output produces either a single generalized value or multiple meaningful values

Core Purpose: The framework aims to take a single value and:

  • Track its temporal evolution within a network of influences
  • Analyze its statistical behavior through mathematical functions
  • Identify weighted correlational relationships with other variables
  • Ultimately synthesize these insights through ML/DL algorithms to generate either a unified understanding or multiple meaningful outputs

This systematic approach demonstrates how a single data point can be transformed into comprehensive insights by considering both its temporal dynamics and relational context, ultimately leveraging advanced analytics for meaningful interpretation.

The framework’s strength lies in its ability to combine temporal patterns, relational insights, and advanced analytics into a cohesive analytical approach, providing a more complete understanding of how values evolve and relate within a complex system.