Operations : Changes Detection and then

Process Analysis from “Change Drives Operations” Perspective

Core Philosophy

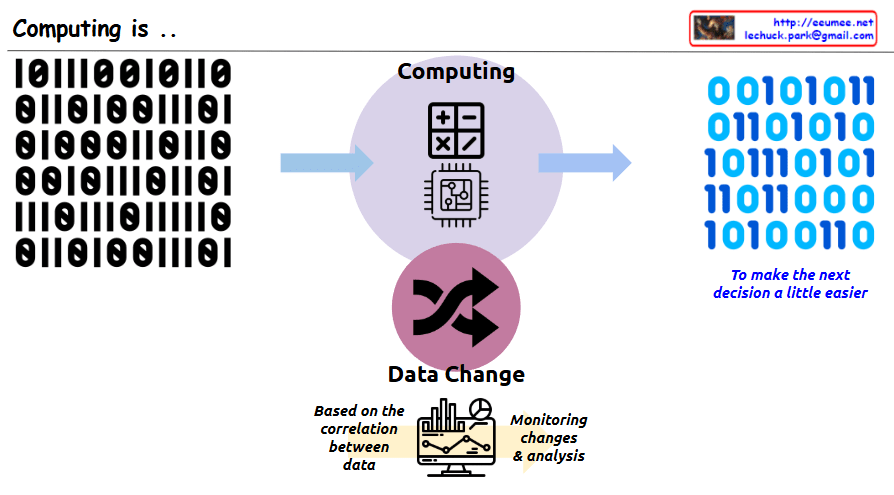
“No Change, No Operation” – This diagram illustrates the fundamental IT operations principle that operations are driven by change detection.

Change-Centric Operations Framework

1. Change Detection as the Starting Point of All Operations

  • Top-tier monitoring systems continuously detect changes
  • No Changes = No Operations (left gray boxes)
  • Change Detected = Operations Initiated (blue boxes)

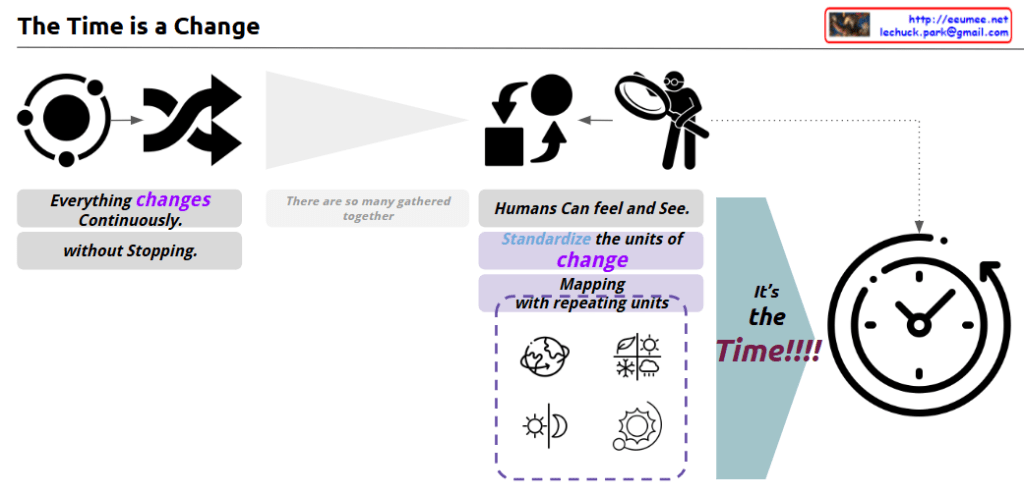
2. Operational Strategy Based on Change Characteristics

Change Detection → Operational Need Assessment → Appropriate Response
  • Normal Changes → Standard operational activities
  • Anomalies → Immediate response operations
  • Real-time Events → Emergency operational procedures

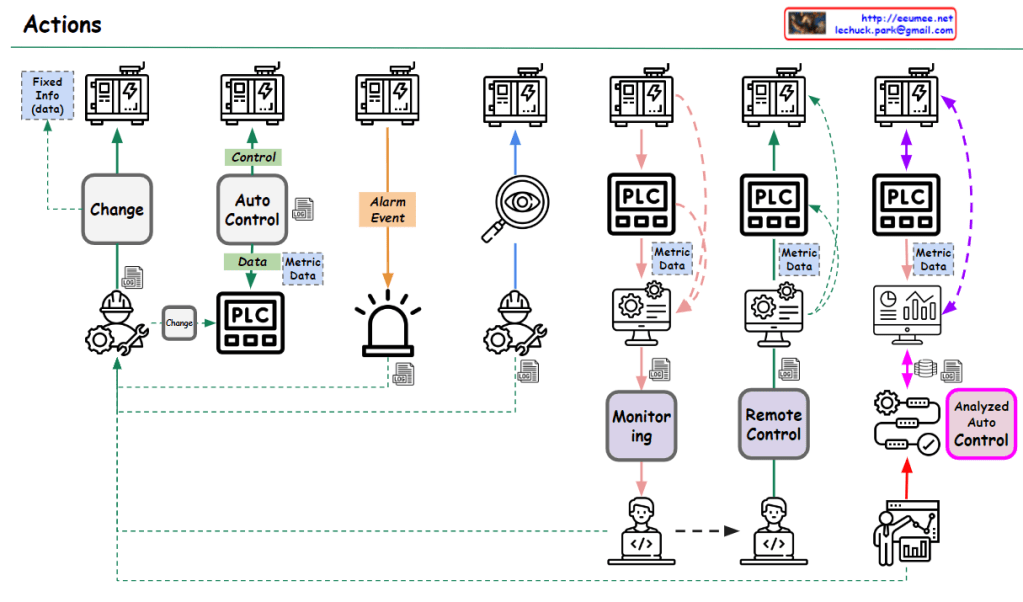
3. Cyclical Structure Based on Operational Outcomes

  • Maintenance: Stable operations maintained through proper change management
  • Fault/Big Cost: Increased costs due to inadequate response to changes

Key Insights

“Change Determines Operations”

  1. System without change = No intervention required
  2. System with change = Operational activity mandatory
  3. Early change detection = Efficient operations
  4. Proper change classification = Optimized resource allocation

Operational Paradigm

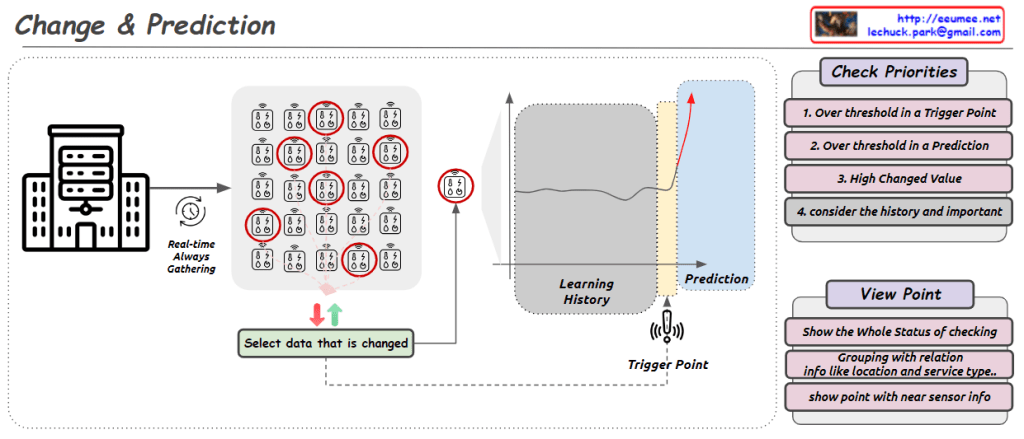
This diagram demonstrates the evolution from Reactive Operations to Proactive Operations, where:

  • Traditional Approach: Wait for problems → React
  • Modern Approach: Detect changes → Predict → Respond proactively

The framework recognizes change as the trigger for all operational activities, embodying the contemporary IT operations paradigm where:

  • Operations are event-driven rather than schedule-driven
  • Intelligence (AI/Analytics) transforms raw change data into actionable insights
  • Automation ensures appropriate responses to different types of changes

This represents a shift toward Change-Driven Operations Management, where the operational workload directly correlates with the rate and nature of system changes, enabling more efficient resource utilization and better service reliability.

With Claude

Computing is ..

This image illustrates the core concept of “Computing.” The key message is that computing is a process of transforming data to make people’s next decisions easier.

In the center, there is a circle with the title “Computing” along with calculator and computer chip icons. On the left side, there is binary input data (0s and 1s), which is shown being transformed through the central computing process into different binary output on the right side. Next to the binary output on the right is blue italic text saying “To make the next decision a little easier,” emphasizing that the purpose of this data transformation is to aid human decision-making.

At the bottom of the image, there is a section titled “Data Change” with cycling arrows representing data transformation. Below that, there’s a monitor displaying charts and graphs with descriptions “Based on the correlation between data” and “Monitoring changes & analysis,” showing that analyzing relationships between data is important for supporting decision-making.

With Claude

Data Center Supply

With Claude
The supply system in data centers follows a unified control flow pattern of “Change → Distribute → Block”. This pattern is consistently applied across all core infrastructure elements (Traffic, Power, and Cooling). Let’s examine each stage and its applications:

1. Change Stage

  • Transforms incoming resources into forms suitable for the system
  • Traffic: Protocol/bandwidth conversion through routers
  • Power: Voltage/current conversion through transformers/UPS
  • Cooling: Temperature conversion through chillers/heat exchangers

2. Distribute Stage

  • Efficiently distributes converted resources where needed
  • Traffic: Network load distribution through switches and load balancers
  • Power: Power distribution through distribution boards and bus ducts
  • Cooling: Cooling air/water distribution through ducts/piping/dampers

3. Block Stage

  • Ensures system protection and security
  • Traffic: Security threat prevention through firewalls/IPS/IDS
  • Power: Overload protection through circuit breakers and fuses
  • Cooling: Backflow prevention through shutoff valves and dampers

Benefits of this unified approach:

  1. Ensures consistency in system design
  2. Increases operational management efficiency
  3. Enables quick problem identification
  4. Improves scalability and maintenance

Detailed breakdown by domain:

Traffic Management

  • Change: Router gateways (Protocol/Bandwidth)
  • Distribute: Switch/L2/L3, Load Balancer
  • Block: Firewall, IPS/IDS, ACL Switch

Power Management

  • Change: Transformer, UPS (Voltage/Current/AC-DC)
  • Distribute: Distribution boards/bus ducts
  • Block: Circuit breakers (MCCB/ACB), ELB, Fuses

Cooling Management

  • Change: Chillers/Heat exchangers (Water→Air)
  • Distribute: Ducts/Piping/Dampers
  • Block: Backflow prevention/isolation/fire dampers, shutoff valves

This structure enables systematic and efficient operation of complex data center infrastructure by managing the three critical supply elements (Traffic, Power, Cooling) within the same framework. Each component plays a specific role in ensuring the reliable and secure operation of the data center, while maintaining consistency across different systems.

The time

with a claude’s help
This image provides deep insights into the essence of time. The key points can be summarized as follows:

  1. Continuity of change: As shown in the image, everything is in a constant state of change. This phenomenon is observed even at the most fundamental atomic level.
  2. Observation and unitization: Humans observe these changes, identify recurring patterns, and define units of time accordingly. For example, units like year, 4 seasons, and day have been created based on the cycles of the Earth’s rotation and revolution.
  3. Humanization of the time concept: The defined time units have been concretized into forms that humans can easily understand and use. In other words, observing natural phenomena and interpreting them from a human-centric perspective is the essence of the time concept we know.
  4. Relationship between change and measurement: Time is a concept measured based on change. The time units we use routinely in daily life are essentially standardizations of natural cycles of change.

From a scientific perspective, this image explains the concept of time from multiple angles. The ceaseless change at the atomic level is a scientific fact, and the accumulation of these microscopic changes manifests as the macroscopic changes we perceive in nature. Humans have observed and measured these natural patterns of change to construct the concept of time.

However, the time units are not entirely objective. They can vary based on human physiological and cultural factors. Therefore, time can be viewed as a product of human interpretation and utilization of natural phenomena.

In summary, this image effectively illustrates the essence of the time concept from various perspectives. It shows how the changes in nature and human observation and measurement have given rise to the idea of time.

Change & Prediction

From Claude with some prompting
This image illustrates a process called “Change & Prediction” which appears to be a system for monitoring and analyzing real-time data streams. The key components shown are:

  1. Real-time data gathering from some source (likely sensors represented by the building icon).
  2. Selecting data that has changed significantly.
  3. A “Learning History” component that tracks and learns from the incoming data over time.
  4. A “Trigger Point” that detects when data values cross certain thresholds.
  5. A “Prediction” component that likely forecasts future values based on the learned patterns.

The “Check Priorities” box lists four criteria for determining which data points deserve attention: exceeding trigger thresholds, predictions crossing thresholds, high change values, and considering historical context.

The “View Point” section suggests options for visualizing the status, grouping related data points (e.g., by location or service type), and showing detailed sensor information.

Overall, this seems to depict an automated monitoring and predictive analytics system for identifying and responding to important changes in real-time data streams from various sources or sensors.